
Page 112 - 2017academicreport
P. 112
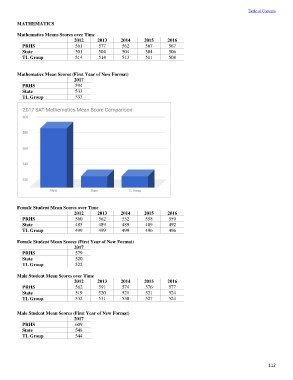
Table of Contents

MATHEMATICS

Mathematics Means Scores over Time

             2012                   2013  2014         2015  2016
                                          562          567   567
PRHS         561 577                      504          504   506
                                          513          511   508
State        501 504

TL Group     514 514

Mathematics Mean Scores (First Year of New Format)

             2017

PRHS         594

State        533

TL Group     533

Female Student Mean Scores over Time

             2012                   2013  2014         2015  2016
                                          552          558   559
PRHS         560 562                      489          489   492
                                          499          496   496
State        485 489
                                                       2015  2016
TL Group     499 499                                   576   577
                                                       521   524
Female Student Mean Scores (First Year of New Format)  527   524

             2017

PRHS         579

State        520

TL Group     522

Male Student Mean Scores over Time

             2012                   2013  2014
                                          574
PRHS         562 591                      521
                                          530
State        519 520

TL Group     532 531

Male Student Mean Scores (First Year of New Format)

             2017

PRHS         609

State        548

TL Group     544

                                                                   112