
Page 14 - 2021 Academic Achievement and Growth Report
P. 14
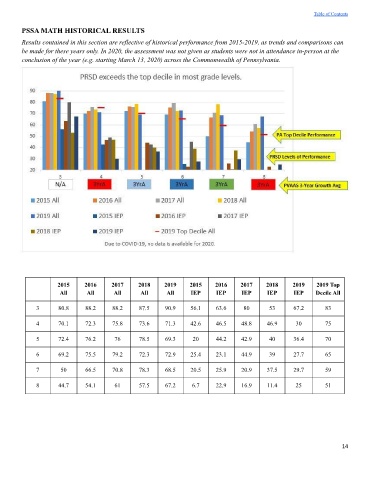
Table of Contents


        PSSA MATH HISTORICAL RESULTS
        Results contained in this section are reflective of historical performance from 2015-2019, as trends and comparisons can
        be made for these years only. In 2020, the assessment was not given as students were not in attendance in-person at the
        conclusion of the year (e.g. starting March 13, 2020) across the Commonwealth of Pennsylvania.


                    2015     2016     2017     2018    2019     2015    2016     2017    2018     2019    2019 Top
                     All      All      All     All      All     IEP      IEP     IEP     IEP      IEP    Decile All

             3      80.8     88.2     88.2     87.5     90.9    56.1    63.6      80      53      67.2       83

             4      70.1     72.3     75.8     73.6     71.3    42.6    46.5     48.8    46.9      30        75

             5      72.4     76.2      76      78.5     69.3     20     44.2     42.9     40      36.4       70

             6      69.2     75.5     79.2     72.3     72.9    25.4    23.1     44.9     39      27.7       65


             7       50      66.5     70.8     78.3     68.5    20.5    25.9     20.9    37.5     29.7       59

             8      44.7     54.1      61      57.5     67.2     6.7    22.9     16.9    11.4      25        51


                                                                                                                  14