
Page 16 - 2021 Academic Achievement and Growth Report
P. 16
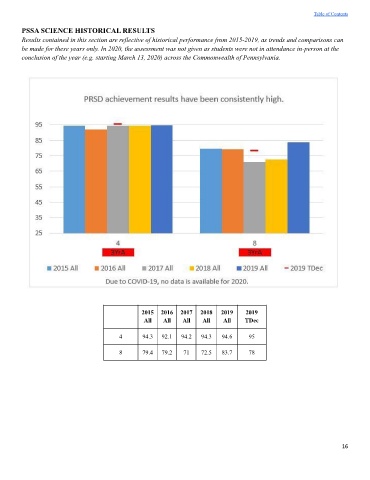
Table of Contents


        PSSA SCIENCE HISTORICAL RESULTS
        Results contained in this section are reflective of historical performance from 2015-2019, as trends and comparisons can
        be made for these years only. In 2020, the assessment was not given as students were not in attendance in-person at the
        conclusion of the year (e.g. starting March 13, 2020) across the Commonwealth of Pennsylvania.


                                                2015  2016   2017  2018   2019    2019
                                                 All   All   All    All    All    TDec


                                        4       94.3   92.1  94.2   94.3  94.6     95

                                        8       79.4   79.2   71    72.5  83.7     78


                                                                                                                  16