
Page 16 - This is Your Presentation Title
P. 16
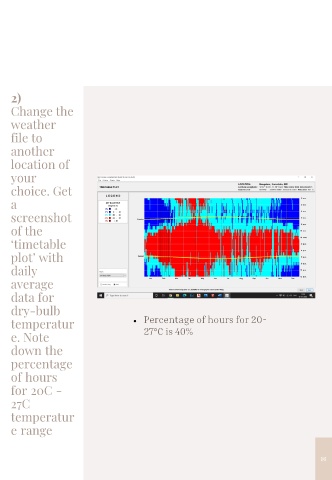
2)
Change the
weather
file to
another
location of
your
choice. Get
a
screenshot
of the
‘timetable
plot’ with
daily
average
data for
dry-bulb
temperatur • Percentage of hours for 20-
e. Note 27C is 40%
down the
percentage
of hours
for 20C -
27C
temperatur
e range
16