
Page 20 - This is Your Presentation Title
P. 20
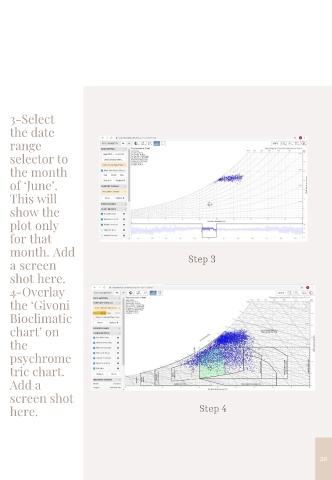
3-Select

    the date

    range
    selector to

    the month

    of ‘June’.

    This will
    show the

    plot only

    for that
    month. Add

    a screen                                                  Step 3

    shot here.

    4-Overlay
    the ‘Givoni

    Bioclimatic

    chart’ on
    the

    psychrome

    tric chart.
    Add a

    screen shot

    here.                                                         Step 4


                                                                                                         20