
Page 38 - Policy_Economic_Report_September2020
P. 38
Policy and Economic Report:
Oil & Gas Market
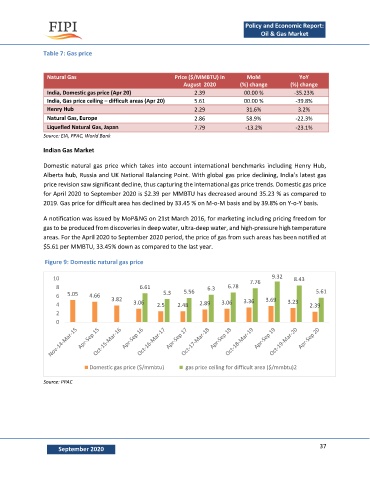
Table 7: Gas price
Natural Gas Price ($/MMBTU) in MoM YoY
August 2020 (%) change (%) change
India, Domestic gas price (Apr 20) 2.39 00.00 % -35.23%
India, Gas price ceiling – difficult areas (Apr 20) 5.61 00.00 % -39.8%
Henry Hub 2.29 31.6% 3.2%
Natural Gas, Europe 2.86 58.9% -22.3%
Liquefied Natural Gas, Japan 7.79 -13.2% -23.1%
Source: EIA, PPAC, World Bank
Indian Gas Market
Domestic natural gas price which takes into account international benchmarks including Henry Hub,
Alberta hub, Russia and UK National Balancing Point. With global gas price declining, India’s latest gas
price revision saw significant decline, thus capturing the international gas price trends. Domestic gas price
for April 2020 to September 2020 is $2.39 per MMBTU has decreased around 35.23 % as compared to
2019. Gas price for difficult area has declined by 33.45 % on M-o-M basis and by 39.8% on Y-o-Y basis.
A notification was issued by MoP&NG on 21st March 2016, for marketing including pricing freedom for
gas to be produced from discoveries in deep water, ultra-deep water, and high-pressure high temperature
areas. For the April 2020 to September 2020 period, the price of gas from such areas has been notified at
$5.61 per MMBTU, 33.45% down as compared to the last year.
Figure 9: Domestic natural gas price
10 9.32 8.43
7.76
8 6.61 6.3 6.78
6 5.05 4.66 5.3 5.56 5.61
3.82 3.36 3.69
4 3.06 2.5 2.48 2.89 3.06 3.23 2.39
2
0
Domestic gas price ($/mmbtu) gas price ceiling for difficult area ($/mmbtu)2
Source: PPAC
37
September 2020