Page 36 - Policy_Economic_Report_September2020
P. 36

Policy and Economic Report:
                                                                                       Oil & Gas Market


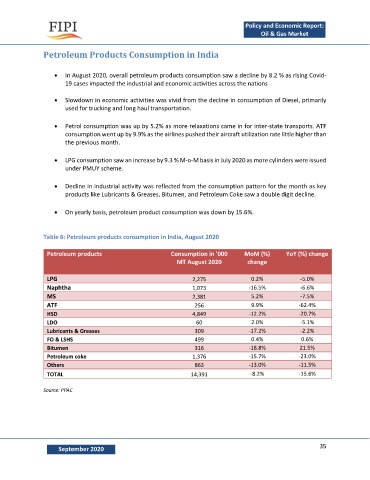
               Petroleum Products Consumption in India


                     In August 2020, overall petroleum products consumption saw a decline by 8.2 % as rising Covid-
                       19 cases impacted the industrial and economic activities across the nations

                     Slowdown in economic activities was vivid from the decline in consumption of Diesel, primarily
                       used for trucking and long haul transportation.

                     Petrol consumption was up by 5.2% as more relaxations came in for inter-state transports. ATF
                       consumption went up by 9.9% as the airlines pushed their aircraft utilization rate little higher than
                       the previous month.

                     LPG consumption saw an increase by 9.3 % M-o-M basis in July 2020 as more cylinders were issued
                       under PMUY scheme.

                     Decline in industrial activity was reflected from the consumption pattern for the month as key
                       products like Lubricants & Greases, Bitumen, and Petroleum Coke saw a double digit decline.

                     On yearly basis, petroleum product consumption was down by 15.6%.


               Table 6: Petroleum products consumption in India, August 2020

                 Petroleum products                       Consumption in '000     MoM (%)       YoY (%) change
                                                            MT August 2020         change

                 LPG                                             2,275              0.2%            -5.0%
                 Naphtha                                         1,073             -16.5%           -6.6%
                 MS                                              2,381              5.2%            -7.5%
                 ATF                                             256                9.9%            -62.4%
                 HSD                                             4,849             -12.2%           -20.7%
                 LDO                                              60                2.0%            -5.1%
                 Lubricants & Greases                            309               -17.2%           -2.2%
                 FO & LSHS                                       499                0.4%             0.6%
                 Bitumen                                         316               -18.8%           21.5%
                 Petroleum coke                                  1,376             -15.7%           -23.0%
                 Others                                          863               -13.0%           -11.5%
                 TOTAL                                          14,391              -8.2%           -15.6%

               Source: PPAC


                                                                                                           35
                    September 2020
   31   32   33   34   35   36   37   38   39   40   41