
Page 32 - Policy_Economic_Report_September2020
P. 32
Policy and Economic Report:
Oil & Gas Market
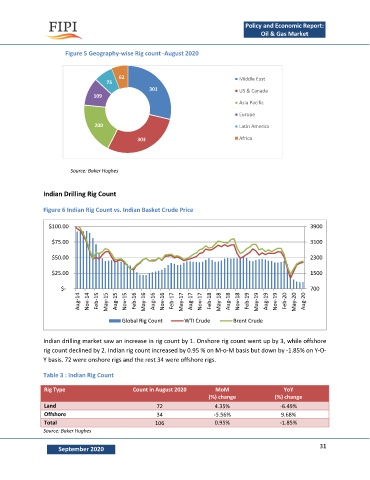
Figure 5 Geography-wise Rig count -August 2020
62 Middle East
75
301 US & Canada
109
Asia Pacific
Europe
200 Latin America
303 Africa
Source: Baker Hughes
Indian Drilling Rig Count
Figure 6 Indian Rig Count vs. Indian Basket Crude Price
$100.00 3900
$75.00 3100
$50.00 2300
$25.00 1500
$- 700
Aug-14 Nov-14 Feb-15 May-15 Aug-15 Nov-15 Feb-16 May-16 Aug-16 Nov-16 Feb-17 May-17 Aug-17 Nov-17 Feb-18 May-18 Aug-18 Nov-18 Feb-19 May-19 Aug-19 Nov-19 Feb-20 May-20 Aug-20
Global Rig Count WTI Crude Brent Crude
Indian drilling market saw an increase in rig count by 1. Onshore rig count went up by 3, while offshore
rig count declined by 2. Indian rig count increased by 0.95 % on M-o-M basis but down by -1.85% on Y-O-
Y basis. 72 were onshore rigs and the rest 34 were offshore rigs.
Table 3 : Indian Rig Count
Rig Type Count in August 2020 MoM YoY
(%) change (%) change
Land 72 4.35% -6.49%
Offshore 34 -5.56% 9.68%
Total 106 0.95% -1.85%
Source: Baker Hughes
31
September 2020