
Page 31 - Policy_Economic_Report_September2020
P. 31
Policy and Economic Report:
Oil & Gas Market
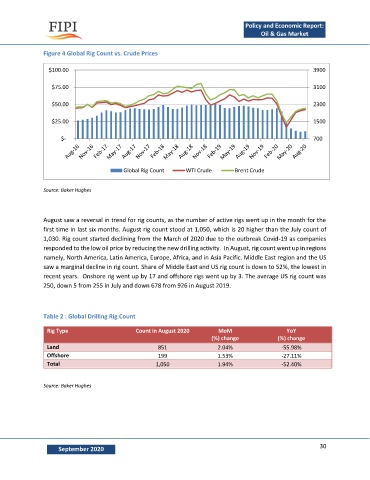
Figure 4 Global Rig Count vs. Crude Prices
$100.00 3900
$75.00 3100
$50.00 2300
$25.00 1500
$- 700
Global Rig Count WTI Crude Brent Crude
Source: Baker Hughes
August saw a reversal in trend for rig counts, as the number of active rigs went up in the month for the
first time in last six months. August rig count stood at 1,050, which is 20 higher than the July count of
1,030. Rig count started declining from the March of 2020 due to the outbreak Covid-19 as companies
responded to the low oil price by reducing the new drilling activity. In August, rig count went up in regions
namely, North America, Latin America, Europe, Africa, and in Asia Pacific. Middle East region and the US
saw a marginal decline in rig count. Share of Middle East and US rig count is down to 52%, the lowest in
recent years. Onshore rig went up by 17 and offshore rigs went up by 3. The average US rig count was
250, down 5 from 255 in July and down 678 from 926 in August 2019.
Table 2 : Global Drilling Rig Count
Rig Type Count in August 2020 MoM YoY
(%) change (%) change
Land 851 2.04% -55.98%
Offshore 199 1.53% -27.11%
Total 1,050 1.94% -52.40%
Source: Baker Hughes
30
September 2020