
Page 182 - PhD GT
P. 182
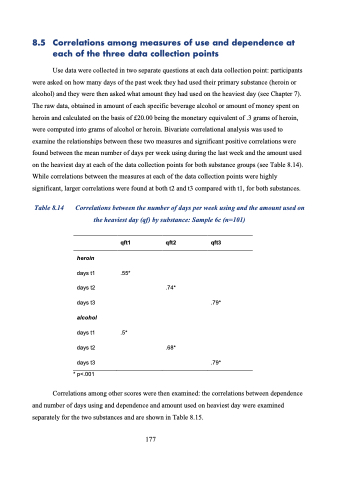
8.5 Correlations among measures of use and dependence at each of the three data collection points
Use data were collected in two separate questions at each data collection point: participants were asked on how many days of the past week they had used their primary substance (heroin or alcohol) and they were then asked what amount they had used on the heaviest day (see Chapter 7). The raw data, obtained in amount of each specific beverage alcohol or amount of money spent on heroin and calculated on the basis of £20.00 being the monetary equivalent of .3 grams of heroin, were computed into grams of alcohol or heroin. Bivariate correlational analysis was used to examine the relationships between these two measures and significant positive correlations were found between the mean number of days per week using during the last week and the amount used on the heaviest day at each of the data collection points for both substance groups (see Table 8.14). While correlations between the measures at each of the data collection points were highly significant, larger correlations were found at both t2 and t3 compared with t1, for both substances.
Table 8.14
Correlations between the number of days per week using and the amount used on the heaviest day (qf) by substance: Sample 6c (n=101)
    qft1
.55*
.5*
qft2 qft3
    heroin
days t1
days t2
days t3
alcohol
days t1
days t2
days t3 * p<.001
.74*
.68*
.79*
.79*
   Correlations among other scores were then examined: the correlations between dependence and number of days using and dependence and amount used on heaviest day were examined separately for the two substances and are shown in Table 8.15.
177
