
Page 183 - PhD GT
P. 183
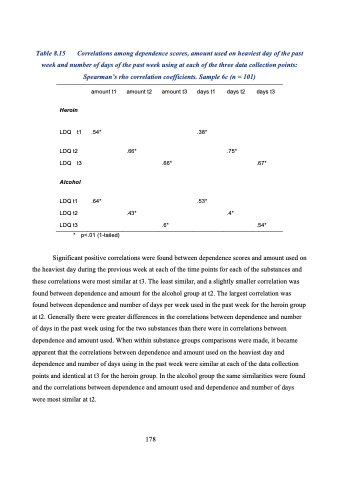
Table 8.15 Correlations among dependence scores, amount used on heaviest day of the past week and number of days of the past week using at each of the three data collection points: Spearman’s rho correlation coefficients. Sample 6c (n = 101)
       Heroin
LDQ t1 .54*
LDQ t2 LDQ t3
Alcohol
LDQ t1 LDQ t2 LDQ t3
*
amount t1
amount t2
.66*
.43*
amount t3
.66*
.6*
days t1
.38*
.53*
days t2
.75*
.4*
days t3
.67*
.54*
.64*
p<.01 (1-tailed)
     Significant positive correlations were found between dependence scores and amount used on the heaviest day during the previous week at each of the time points for each of the substances and these correlations were most similar at t3. The least similar, and a slightly smaller correlation was found between dependence and amount for the alcohol group at t2. The largest correlation was found between dependence and number of days per week used in the past week for the heroin group at t2. Generally there were greater differences in the correlations between dependence and number of days in the past week using for the two substances than there were in correlations between dependence and amount used. When within substance groups comparisons were made, it became apparent that the correlations between dependence and amount used on the heaviest day and dependence and number of days using in the past week were similar at each of the data collection points and identical at t3 for the heroin group. In the alcohol group the same similarities were found and the correlations between dependence and amount used and dependence and number of days were most similar at t2.
178
