
Page 184 - PhD GT
P. 184
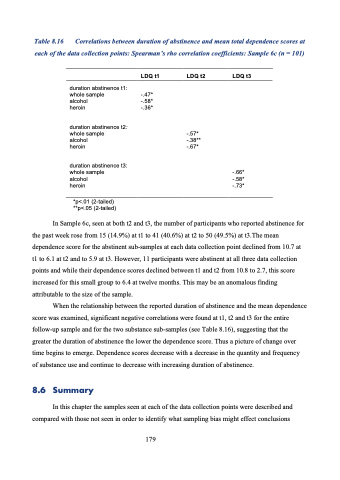
Table 8.16 Correlations between duration of abstinence and mean total dependence scores at each of the data collection points: Spearman’s rho correlation coefficients: Sample 6c (n = 101)
LDQ t1 LDQ t2 LDQ t3
      duration abstinence t1: whole sample
alcohol
heroin
   -.47* -.58* -.36*
      duration abstinence t2: whole sample
alcohol
heroin
      -.57* -.38** -.67*
      duration abstinence t3: whole sample
alcohol
heroin
     -.66* -.58* -.73*
*p<.01 (2-tailed) **p<.05 (2-tailed)
In Sample 6c, seen at both t2 and t3, the number of participants who reported abstinence for the past week rose from 15 (14.9%) at t1 to 41 (40.6%) at t2 to 50 (49.5%) at t3.The mean dependence score for the abstinent sub-samples at each data collection point declined from 10.7 at t1 to 6.1 at t2 and to 5.9 at t3. However, 11 participants were abstinent at all three data collection points and while their dependence scores declined between t1 and t2 from 10.8 to 2.7, this score increased for this small group to 6.4 at twelve months. This may be an anomalous finding attributable to the size of the sample.
When the relationship between the reported duration of abstinence and the mean dependence score was examined, significant negative correlations were found at t1, t2 and t3 for the entire follow-up sample and for the two substance sub-samples (see Table 8.16), suggesting that the greater the duration of abstinence the lower the dependence score. Thus a picture of change over time begins to emerge. Dependence scores decrease with a decrease in the quantity and frequency of substance use and continue to decrease with increasing duration of abstinence.
8.6 Summary
In this chapter the samples seen at each of the data collection points were described and compared with those not seen in order to identify what sampling bias might effect conclusions
179
