
Page 215 - PhD GT
P. 215
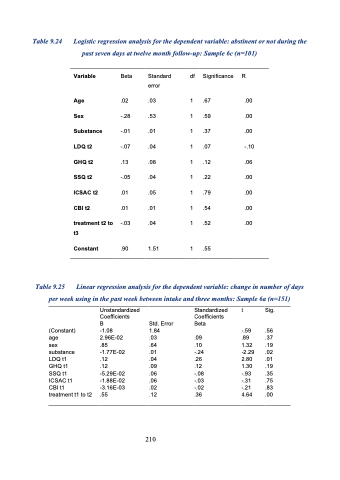
Table 9.24
Logistic regression analysis for the dependent variable: abstinent or not during the past seven days at twelve month follow-up: Sample 6c (n=101)
            Variable
Age
Sex Substance LDQ t2 GHQ t2 SSQ t2 ICSAC t2 CBI t2
Constant
Beta Standard error
.02 .03 -.28 .53 -.01 .01 -.07 .04 .13 .08 -.05 .04 .01 .05 .01 .01
.90 1.51
df Significance R
1 .67 .00 1 .59 .00 1 .37 .00 1 .07 -.10 1 .12 .06 1 .22 .00 1 .79 .00 1 .54 .00 1
1 .55
                                     treatment t2 to t3
    -.03
   .04
   .52
    .00
      Table 9.25
per week using in the past week between intake and three months: Sample 6a (n=151)
Linear regression analysis for the dependent variable: change in number of days
      Unstandardized Coefficients
B
-1.08
2.96E-02 .85 -1.77E-02 .12
.12 -5.29E-02 -1.88E-02 -3.16E-03 .55
Standardized t Sig.
Coefficients Std. Error Beta
      (Constant)
age
sex
substance
LDQ t1
GHQ t1
SSQ t1
ICSAC t1
CBI t1
treatment t1 to t2
1.84 .03 .64 .01 .04 .09 .06 .06 .02 .12
-.59 .56 .09 .89 .37 .10 1.32 .19 -.24 -2.29 .02 .26 2.80 .01 .12 1.30 .19 -.08 -.93 .35 -.03 -.31 .75 -.02 -.21 .83 .36 4.64 .00
                                                            210
