Page 29 - CompleteBooklet2021
P. 29

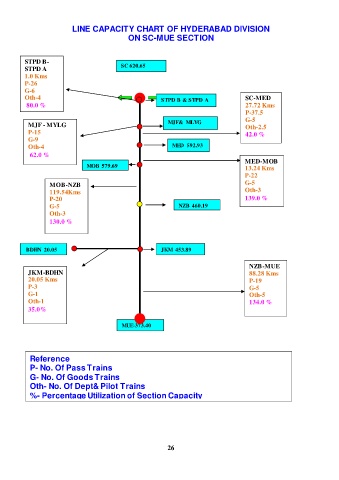
LINE CAPACITY CHART OF HYDERABAD DIVISION
                                              ON SC-MUE SECTION


          STPD B-

          STPD A                            SC 620.65

          1.0 Kms

          P-26
          G-6

          Oth-4                                           STPD B & STPD A              SC-MED

           80.0 %                                                                      27.72 Kms
                                                                                       P-37.5
                                                            MJF&  MLYG                 G-5
           MJF - MYLG                                                                  Oth-2.5

           P-15                                                                        42.0 %
              G-9
           Oth-4                                              MED  592.93

            62.0 %

                               MOB 579.69                                              MED-MOB
                                                                                       13.24 Kms
                                                                                       P-22
                  MOB-NZB                                                              G-5
                  119.54Kms                                                            Oth-3
                                                                                       139.0 %
                  P-20                                          NZB 460.19
                  G-5
                  Oth-3
                  130.0 %


           BDHN  20.05                                    JKM  453.89

                                                                                         NZB-MUE
           JKM-BDHN                                                                      88.28 Kms

           20.05 Kms                                                                     P-19
              P-3                                                                        G-5
           G-1                                                                           Oth-5

           Oth-1                                                                         134.0 %

           35.0%

                                            MUE-373.40


              Reference
              P- No. Of Pass Trains
              G- No. Of Goods Trains
              Oth- No. Of Dept& Pilot Trains
            %- Percentage Utilization of Section Capacity


                                                            26
   24   25   26   27   28   29   30   31   32   33   34