
Page 16 - Exam-3rd-2023-Mar
P. 16
No . 25
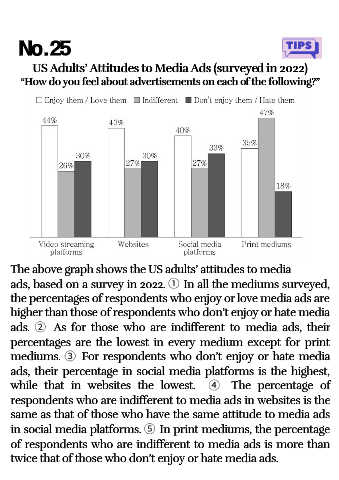
US Adults’ Attitudes to Media Ads (surveyed in 2022)
“How do you feel about advertisements on each of the following?”
The above graph shows the US adults’ attitudes to media
ads, based on a survey in 2022. ① In all the mediums surveyed,
the percentages of respondents who enjoy or love media ads are
higher than those of respondents who don’t enjoy or hate media
ads. ② As for those who are indifferent to media ads, their
percentages are the lowest in every medium except for print
mediums. ③ For respondents who don’t enjoy or hate media
ads, their percentage in social media platforms is the highest,
while that in websites the lowest. ④ The percentage of
respondents who are indifferent to media ads in websites is the
same as that of those who have the same attitude to media ads
in social media platforms. ⑤ In print mediums, the percentage
of respondents who are indifferent to media ads is more than
twice that of those who don’t enjoy or hate media ads.