
Page 42 - Transforming To Stay Successful
P. 42
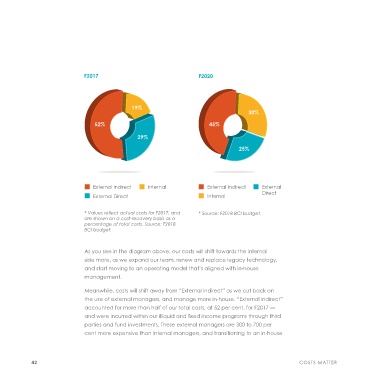
F2017                                  F2020


                                              19%
                                                                                      30%

                                 52%                                     45%
                                                29%

                                                                                   25%


                                 External Indirect  Internal            External Indirect   External
                                                                                           Direct
                                 External Direct                        Internal


                              * Values reflect actual costs for F2017, and   * Source: F2018 BCI budget.
                              are shown on a cost-recovery basis as a
                              percentage of total costs. Source: F2018
                              BCI budget.


                              As you see in the diagram above, our costs will shift towards the internal
                              side more, as we expand our team, renew and replace legacy technology,
                              and start moving to an operating model that’s aligned with in-house
                              management.

                              Meanwhile, costs will shift away from “External Indirect” as we cut back on
                              the use of external managers, and manage more in-house. “External Indirect”
                              accounted for more than half of our total costs, at 52 per cent, for F2017 —
                              and were incurred within our illiquid and fixed income programs through third
                              parties and fund investments. These external managers are 300 to 700 per
                              cent more expensive than internal managers, and transitioning to an in-house


            42                                                                                         COSTS MATTER