
Page 5 - TEST Young Latino Voters 082020
P. 5
The Young Latino Voter
Methodology
This report is based on a national online survey of 1,323 registered voters. The study includes Latinos ages 18 to 34,
inclusive of Gen Z and Millennials, and was offered in both English and Spanish. Fieldwork was conducted between
June 5 and June 22, 2020, when the Black Lives Matter protests were in full swing and the coronavirus outbreak was
in its fourth month. The sample excludes non-registered voters and 5% who report being registered but unengaged,
with no plans to vote in November 2020.
Before the final tabulations and analysis, the sample was statistically balanced to accurately reflect the basic
demographic traits of the U.S. registered voter population. Additionally, Latinos were balanced by country of origin to
national Current Population Survey voter registration estimates.
Reading This Report
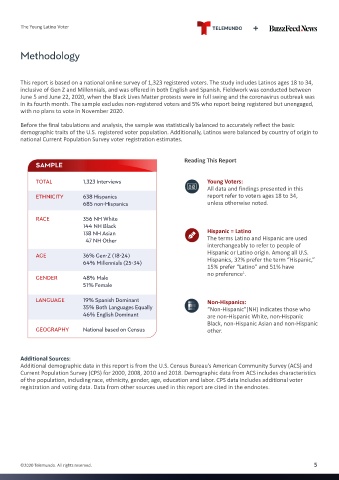
SAMPLE
TOTAL 1,323 Interviews Young Voters:
All data and findings presented in this
ETHNICITY 638 Hispanics report refer to voters ages 18 to 34,
685 non-Hispanics unless otherwise noted.
RACE 356 NH White
144 NH Black
138 NH Asian Hispanic = Latino
47 NH Other The terms Latino and Hispanic are used
interchangeably to refer to people of
Hispanic or Latino origin. Among all U.S.
AGE 36% Gen-Z (18-24) Hispanics, 32% prefer the term “Hispanic,”
64% Millennials (25-34)
15% prefer “Latino” and 51% have
no preference .
1
GENDER 48% Male
51% Female
LANGUAGE 19% Spanish Dominant Non-Hispanics:
35% Both Languages Equally “Non-Hispanic”(NH) indicates those who
46% English Dominant are non-Hispanic White, non-Hispanic
Black, non-Hispanic Asian and non-Hispanic
GEOGRAPHY National based on Census other.
Additional Sources:
Additional demographic data in this report is from the U.S. Census Bureau’s American Community Survey (ACS) and
Current Population Survey (CPS) for 2000, 2008, 2010 and 2018. Demographic data from ACS includes characteristics
of the population, including race, ethnicity, gender, age, education and labor. CPS data includes additional voter
registration and voting data. Data from other sources used in this report are cited in the endnotes.
©2020 Telemundo. All rights reserved. 5