
Page 24 - Data Driven
P. 24
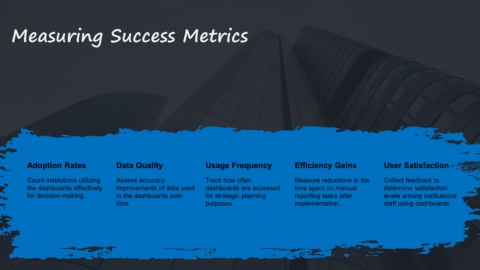
Measuring Success Metrics


            Adoption Rates                      Data Quality                       Usage Frequency                     Efficiency Gains                    User Satisfaction


            Count institutions utilizing        Assess accuracy                    Track how often                     Measure reductions in the           Collect feedback to
            the dashboards effectively          improvements of data used          dashboards are accessed             time spent on manual                determine satisfaction
            for decision-making.                in the dashboards over             for strategic planning              reporting tasks after               levels among institutional
                                                time.                              purposes.                           implementation.                     staff using dashboards.