
Page 27 - Data Driven
P. 27
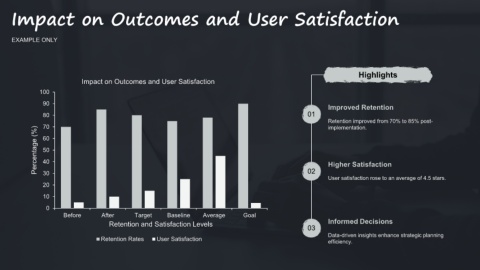
Impact on Outcomes and User Satisfaction


      EXAMPLE ONLY


                                                                                                                                                 Highlights
                                  Impact on Outcomes and User Satisfaction

                 100

                  90                                                                                                                Improved Retention

                  80                                                                                                        01
                                                                                                                                    Retention improved from 70% to 85% post-
                  70                                                                                                                implementation.
                Percentage (%)  50                                                                                                  Higher Satisfaction
                  60


                  40

                                                                                                                            02
                  30
                                                                                                                                    User satisfaction rose to an average of 4.5 stars.
                  20

                  10

                   0
                          Before          After        Target       Baseline      Average         Goal
                                             Retention and Satisfaction Levels                                                      Informed Decisions
                                                                                                                            03
                                                                                                                                    Data-driven insights enhance strategic planning
                                         Retention Rates        User Satisfaction                                                   efficiency.