
Page 18 - AHATA_Neat
P. 18
a7
local Thursday 2 March 2023
Solid tourism performance drove Aruban economy in the third
quarter of 2022
(Oranjestad)—Today, the Centrale also contributed to tourism perfor-
Bank van Aruba (CBA) published mance in the period under review.
the State of the Economy report for
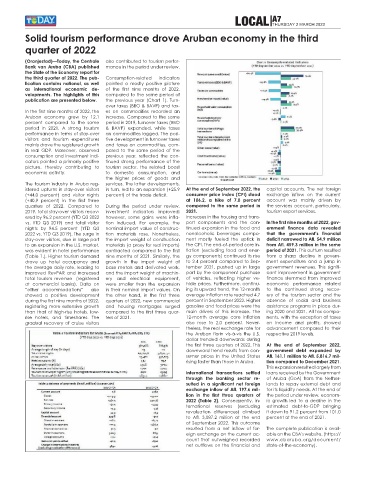
the third quarter of 2022. The pub- Consumption-related indicators
lication contains national, as well painted a mostly positive picture
as international economic de- of the first nine months of 2022,
velopments. The highlights of this compared to the same period of
publication are presented below. the previous year (Chart 1). Turn-
over taxes (BBO & BAVP) and tax-
In the first nine months of 2022, the es on commodities recorded an
Aruban economy grew by 12.1 increase. Compared to the same
percent compared to the same period in 2019, turnover taxes (BBO
period in 2021. A strong tourism & BAVP) expanded, while taxes
performance in terms of stay-over on commodities lagged. The posi-
visitors and tourism expenditures tive development in turnover taxes
mainly drove the registered growth and taxes on commodities, com-
in real GDP. Moreover, observed pared to the same period of the
consumption and investment indi- previous year, reflected the con-
cators painted a primarily positive tinued strong performance of the
picture, thereby contributing to tourism sector, the related boost
economic activity. to domestic consumption, and
the higher prices of goods and
The tourism industry in Aruba reg- services. The latter developments,
istered upturns in stay-over visitors in turn, led to an expansion (+25.9 At the end of September 2022, the capital accounts. The net foreign
(+44.0 percent) and visitor nights percent) of the trade deficit. consumer price index (CPI) stood exchange inflow on the current
(+40.9 percent) in the first three at 106.2, a hike of 7.0 percent account was mainly driven by
quarters of 2022. Compared to During the period under review, compared to the same period in the services account, particularly,
2019, total stay-over visitors recov- investment indicators improved; 2021. tourism export services.
ered by 96.2 percent (YTD Q3 2022 however, some gains were infla- Increases in the housing and trans-
vs. YTD Q3 2019) and total visitor tion induced. For example, the port components and the con- In the first nine months of 2022, gov-
nights by 94.5 percent (YTD Q3 nominal import value of construc- tinued expansion in the food and ernment finance data revealed
2022 vs. YTD Q3 2019). The surge in tion materials rose. Nonetheless, nonalcoholic beverages compo- that the government’s financial
stay-over visitors, due in large part the import weight of construction nent mostly fueled the uptick in deficit narrowed to Afl. 54.9 million
to an expansion in the U.S. market, materials (a proxy for real imports) the CPI. The end-of-period core in- from Afl. 459.3 million in the same
was evident in hotel performance contracted compared to the first flation (excluding food and ener- period of 2021. This outturn resulted
(Table 1.). Higher tourism demand nine months of 2021. Similarly, the gy components) continued its rise from a sharp decline in govern-
drove up hotel occupancy and growth in the import weight of to 2.4 percent compared to Sep- ment expenditure and a jump in
the average daily rate, leading to base metals and derivated work, tember 2021, pushed up in large government revenues. This signifi-
improved RevPAR and increased and the import weight of machin- part by the component purchase cant improvement in government
total tourism revenue (registered ery and electrical equipment, of vehicles, reflecting higher ve- finance stemmed from improved
at commercial banks). Data on were smaller than the expansion hicle prices. Furthermore, continu- economic performance related
“other accommodations” also in their nominal import values. On ing its upward trend, the 12-month to the continued strong recov-
showed a positive development the other hand, in the first three average inflation rate reached 4.7 ery of the tourism sector and the
during the first nine months of 2022, quarters of 2022, new commercial percent in September 2022. Higher absence of social and business
registering more extensive growth and housing mortgages surged gasoline and food prices were the assistance programs in place dur-
than that of high-rise hotels, low- compared to the first three quar- main drivers of this increase. The ing 2020 and 2021. All tax compo-
rise hotels, and timeshares. The ters of 2021. 12-month average core inflation nents, with the exception of taxes
gradual recovery of cruise visitors also rose to 2.0 percent. Never- on income and profits, showed
theless, the real exchange rate for advancement compared to their
the Aruban florin vis-à-vis the U.S. respective 2019 levels.
dollar trended downwards during
the first three quarters of 2022. This At the end of September 2022,
downward trend results from con- government debt expanded by
sumer prices in the United States Afl. 161.1 million to Afl. 5,816.7 mil-
rising faster than those in Aruba. lion compared to December 2021.
This expansion resulted largely from
International transactions settled loans received by the Government
through the banking sector re- of Aruba (GoA) from the Nether-
sulted in a significant net foreign lands to repay external debt and
exchange inflow of Afl. 197.6 mil- for its liquidity needs. At the end of
lion in the first three quarters of the period under review, econom-
2022 (Table 2). Consequently, in- ic growth led to a decline in the
ternational reserves (excluding estimated debt-to-GDP bringing
revaluation differences) climbed it down to 91.2 percent from 101.0
to Afl. 3,087.2 million at the end percent at the end of 2021.
of September 2022. This outcome
resulted from a net inflow of for- The complete publication is avail-
eign exchange on the current ac- able on the CBA's website. (https://
count that outweighed recorded www.cbaruba.org/document/
net outflows on the financial and state-of-the-economy).