
Page 485 - ITGC_Audit Guides
P. 485
Appendix – Three Examples of Continuous Auditing
A.3 — Ongoing Risk Assessment of a
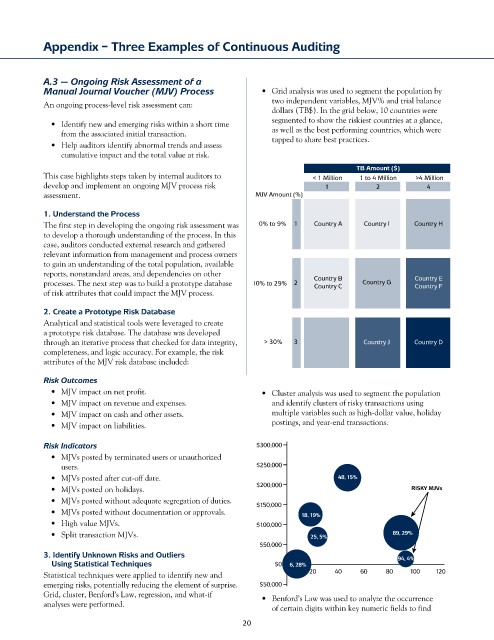
Manual Journal Voucher (MJV) Process • Grid analysis was used to segment the population by
An ongoing process-level risk assessment can: two independent variables, MJV% and trial balance
dollars (TB$). In the grid below, 10 countries were
• Identify new and emerging risks within a short time segmented to show the riskiest countries at a glance,
from the associated initial transaction. as well as the best performing countries, which were
• Help auditors identify abnormal trends and assess tapped to share best practices.
cumulative impact and the total value at risk.
TB Amount ($)
This case highlights steps taken by internal auditors to < 1 Million 1 to 4 Million >4 Million
develop and implement an ongoing MJV process risk 1 2 4
assessment. MJV Amount (%)
1. Understand the Process
The first step in developing the ongoing risk assessment was 0% to 9% 1 Country A Country I Country H
to develop a thorough understanding of the process. In this
case, auditors conducted external research and gathered
relevant information from management and process owners
to gain an understanding of the total population, available
reports, nonstandard areas, and dependencies on other
processes. The next step was to build a prototype database 10% to 29% 2 Country B Country G Country E
Country F
Country C
of risk attributes that could impact the MJV process.
2. Create a Prototype Risk Database
Analytical and statistical tools were leveraged to create
a prototype risk database. The database was developed
through an iterative process that checked for data integrity, > 30% 3 Country J Country D
completeness, and logic accuracy. For example, the risk
attributes of the MJV risk database included:
Risk Outcomes
• MJV impact on net profit. • Cluster analysis was used to segment the population
• MJV impact on revenue and expenses. and identify clusters of risky transactions using
• MJV impact on cash and other assets. multiple variables such as high-dollar value, holiday
• MJV impact on liabilities. postings, and year-end transactions.
Risk Indicators $300,000
• MJVs posted by terminated users or unauthorized
users. $250,000
• MJVs posted after cut-off date. 48, 15%
• MJVs posted on holidays. $200,000 RISKY MJVs
• MJVs posted without adequate segregation of duties. $150,000
• MJVs posted without documentation or approvals. 18, 19%
• High value MJVs. $100,000
• Split transaction MJVs. 25, 5% 89, 29%
$50,000
3. Identify Unknown Risks and Outliers 94, 4%
Using Statistical Techniques $0 6, 28%
Statistical techniques were applied to identify new and 20 40 60 80 100 120
emerging risks, potentially reducing the element of surprise. $50,000
Grid, cluster, Benford’s Law, regression, and what-if • Benford’s Law was used to analyze the occurrence
analyses were performed. of certain digits within key numeric fields to find
20