
Page 93 - Supplement to Income Tax TY2021
P. 93
11:57 - 4-Jan-2021
Page 17 of 18
Fileid: … /I1040SCHA/2020/A/XML/Cycle07/source
The type and rule above prints on all proofs including departmental reproduction proofs. MUST be removed before printing.
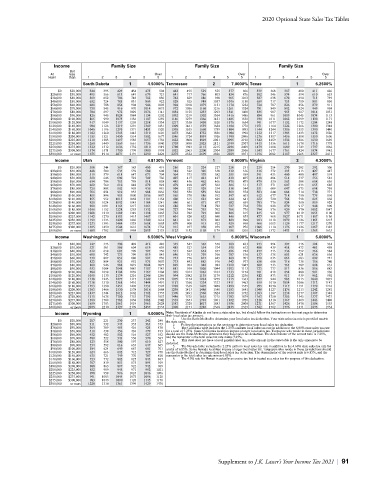
2020 Optional State Sales Tax Tables
Income Family Size Family Size Family Size
But
At less Over Over Over
least than 1 2 3 4 5 5 1 2 3 4 5 5 1 2 3 4 5 5
South Dakota 1 4.5000% Tennessee 2 7.0000% Texas 1 6.2500%
$0 $20,000 344 395 429 454 475 504 442 495 529 555 577 606 339 368 387 400 411 426
$20,000 $30,000 493 566 613 649 679 721 641 717 766 803 834 876 502 546 574 594 610 633
$30,000 $40,000 569 652 706 748 782 830 742 829 886 930 965 1013 587 638 670 694 713 739
$40,000 $50,000 632 724 785 831 869 922 828 925 989 1037 1076 1130 659 717 753 780 801 830
$50,000 $60,000 688 788 854 904 946 1003 904 1010 1079 1131 1174 1232 724 787 826 856 879 911
$60,000 $70,000 738 845 916 970 1014 1075 972 1086 1160 1216 1261 1324 781 849 892 924 949 984
$70,000 $80,000 784 897 972 1029 1076 1141 1034 1155 1233 1293 1341 1408 835 907 953 987 1014 1051
$80,000 $90,000 826 945 1024 1084 1134 1202 1092 1219 1302 1364 1416 1486 884 961 1009 1045 1074 1113
$90,000 $100,000 865 990 1073 1136 1187 1259 1146 1279 1366 1431 1485 1558 930 1011 1062 1099 1130 1171
$100,000 $120,000 917 1049 1137 1203 1258 1334 1217 1358 1450 1520 1576 1654 991 1077 1132 1172 1204 1248
$120,000 $140,000 984 1126 1219 1291 1349 1431 1309 1461 1559 1634 1694 1778 1071 1164 1222 1266 1300 1348
$140,000 $160,000 1046 1196 1295 1371 1433 1520 1395 1555 1660 1739 1804 1893 1144 1244 1306 1353 1390 1440
$160,000 $180,000 1102 1260 1365 1445 1510 1601 1473 1642 1752 1836 1904 1998 1212 1317 1383 1433 1472 1526
$180,000 $200,000 1155 1321 1430 1514 1582 1677 1546 1724 1839 1926 1998 2096 1276 1387 1456 1508 1550 1606
$200,000 $225,000 1210 1383 1497 1585 1657 1756 1622 1808 1929 2021 2095 2198 1342 1459 1532 1586 1630 1689
$225,000 $250,000 1268 1449 1569 1661 1736 1840 1703 1898 2025 2121 2199 2307 1413 1536 1613 1670 1716 1778
$250,000 $275,000 1322 1512 1636 1732 1810 1919 1780 1983 2115 2215 2296 2409 1479 1608 1689 1749 1797 1862
$275,000 $300,000 1374 1571 1700 1799 1880 1993 1852 2063 2200 2304 2389 2506 1543 1677 1761 1824 1874 1942
$300,000 or more 1675 1914 2071 2191 2290 2426 2275 2532 2699 2826 2929 3071 1916 2082 2187 2265 2327 2411
Income Utah 2 4.8130% Vermont 1 6.0000% Virginia 2 4.3000%
$0 $20,000 308 344 367 385 400 419 216 221 224 227 228 231 229 254 270 282 292 306
$20,000 $30,000 448 500 533 559 580 608 314 322 326 330 332 336 336 372 395 413 427 447
$30,000 $40,000 519 579 618 647 671 704 364 373 378 382 385 389 391 433 460 480 497 519
$40,000 $50,000 580 646 690 722 749 786 407 417 423 427 430 435 438 484 514 537 556 581
$50,000 $60,000 634 706 753 789 818 858 445 456 462 466 470 475 479 530 563 588 608 636
$60,000 $70,000 682 760 810 848 879 922 479 490 497 502 506 511 517 571 607 633 655 685
$70,000 $80,000 726 808 862 903 936 981 509 522 529 534 538 544 551 609 647 675 698 730
$80,000 $90,000 766 854 910 953 988 1036 538 551 559 564 569 574 583 644 684 714 738 771
$90,000 $100,000 805 896 955 1000 1036 1087 565 578 586 592 597 603 612 677 718 750 775 810
$100,000 $120,000 855 952 1015 1062 1101 1154 600 615 623 629 634 641 652 720 764 798 825 862
$120,000 $140,000 920 1024 1092 1143 1184 1241 646 661 671 677 682 689 703 776 824 860 889 928
$140,000 $160,000 980 1091 1163 1217 1261 1322 688 705 714 722 727 734 750 828 879 917 948 990
$160,000 $180,000 1036 1152 1228 1285 1332 1396 727 744 755 762 768 776 794 876 929 970 1002 1047
$180,000 $200,000 1088 1210 1289 1349 1398 1465 763 782 793 800 806 815 835 921 977 1019 1053 1100
$200,000 $225,000 1142 1270 1353 1415 1467 1537 801 820 832 840 846 855 877 968 1027 1071 1107 1156
$225,000 $250,000 1199 1333 1420 1486 1540 1614 841 861 873 882 889 898 923 1018 1079 1126 1163 1215
$250,000 $275,000 1253 1393 1484 1553 1608 1685 879 900 913 922 929 938 966 1065 1129 1177 1217 1270
$275,000 $300,000 1305 1450 1544 1616 1674 1754 915 937 950 959 967 976 1006 1110 1176 1226 1267 1323
$300,000 or more 1605 1782 1897 1984 2055 2153 1125 1152 1168 1179 1188 1200 1245 1372 1453 1515 1565 1633
Income Washington 1 6.5000% West Virginia 1 6.0000% Wisconsin 1 5.0000%
$0 $20,000 347 373 390 402 412 426 319 347 365 378 389 403 273 294 307 316 324 334
$20,000 $30,000 521 561 586 604 619 639 485 527 554 574 590 612 408 439 458 472 483 498
$30,000 $40,000 612 658 687 709 727 750 571 622 654 677 696 722 477 513 536 552 566 584
$40,000 $50,000 690 742 775 799 819 845 646 703 739 766 787 816 537 578 603 621 636 656
$50,000 $60,000 759 817 853 880 901 930 713 776 815 845 869 901 590 635 662 683 699 721
$60,000 $70,000 822 884 923 952 975 1007 773 842 885 916 942 977 638 686 716 738 756 780
$70,000 $80,000 880 946 988 1019 1044 1077 829 902 948 982 1010 1047 682 733 765 789 808 833
$80,000 $90,000 933 1004 1048 1081 1107 1143 881 959 1008 1044 1073 1113 723 777 811 836 856 883
$90,000 $100,000 984 1058 1104 1139 1167 1204 929 1012 1063 1102 1133 1174 761 818 854 880 901 930
$100,000 $120,000 1050 1130 1179 1216 1246 1286 994 1082 1138 1179 1212 1256 812 873 911 939 962 992
$120,000 $140,000 1138 1223 1277 1317 1349 1392 1079 1174 1234 1279 1315 1363 877 944 985 1015 1040 1073
$140,000 $160,000 1218 1310 1368 1410 1444 1491 1157 1260 1324 1372 1411 1463 939 1010 1054 1086 1112 1147
$160,000 $180,000 1293 1390 1451 1496 1533 1582 1230 1339 1407 1458 1499 1555 995 1070 1117 1151 1179 1216
$180,000 $200,000 1363 1466 1530 1578 1616 1668 1298 1413 1486 1540 1583 1641 1048 1127 1176 1213 1242 1281
$200,000 $225,000 1437 1544 1612 1662 1702 1757 1370 1491 1568 1624 1670 1732 1103 1187 1238 1277 1307 1348
$225,000 $250,000 1515 1628 1700 1753 1795 1852 1446 1575 1655 1715 1763 1829 1162 1250 1305 1345 1377 1421
$250,000 $275,000 1589 1708 1782 1838 1882 1942 1518 1653 1738 1801 1852 1920 1218 1310 1367 1409 1443 1488
$275,000 $300,000 1659 1783 1861 1919 1965 2028 1587 1728 1817 1883 1936 2008 1271 1367 1426 1470 1506 1553
$300,000 or more 2075 2230 2327 2399 2457 2535 1996 2173 2285 2368 2435 2525 1582 1702 1776 1831 1875 1934
Note: Residents of Alaska do not have a state sales tax, but should follow the instructions on the next page to determine
Income Wyoming 1 4.0000% their local sales tax amount.
1.
Use the Ratio Method to determine your local sales tax deduction. Your state sales tax rate is provided next to
$0 $20,000 207 221 230 237 242 249 the state name.
$20,000 $30,000 311 332 345 355 363 373 2. Follow the instructions on the next page to determine your local sales tax deduction.
$30,000 $40,000 364 389 405 416 425 438 3. The California table includes the 1.25% uniform local sales tax rate in addition to the 6.00% state sales tax rate
$40,000 $50,000 410 438 456 469 479 493 for a total of 7.25%. Some California localities impose a larger local sales tax. Taxpayers who reside in those jurisdictions
$50,000 $60,000 452 482 502 516 527 542 should use the Ratio Method to determine their local sales tax deduction. The denominator of the correct ratio is 7.25%,
$60,000 $70,000 489 522 543 558 570 587 and the numerator is the total sales tax rate minus 7.25%.
This state does not have a local general sales tax, so the amount in the state table is the only amount to be
4.
$70,000 $80,000 523 558 580 597 610 627 deducted.
$80,000 $90,000 554 592 616 633 647 665 5. The Nevada table includes the 2.25% uniform local sales tax rate in addition to the 4.60% state sales tax rate for
$90,000 $100,000 584 624 649 667 681 701 a total of 6.85%. Some Nevada localities impose a larger local sales tax. Taxpayers who reside in those jurisdictions should
$100,000 $120,000 624 666 692 712 727 748 use the Ratio Method to determine their local sales tax deduction. The denominator of the correct ratio is 6.85%, and the
$120,000 $140,000 675 721 749 770 787 810 numerator is the total sales tax rate minus 6.85%.
$140,000 $160,000 723 772 802 825 843 867 6. The 4.0% rate for Hawaii is actually an excise tax but is treated as a sales tax for purpose of this deduction.
$160,000 $180,000 767 819 851 875 894 919
$180,000 $200,000 808 863 897 922 942 969
$200,000 $225,000 852 909 945 971 992 1021
$225,000 $250,000 898 958 996 1024 1046 1076
$250,000 $275,000 941 1005 1044 1073 1096 1128
$275,000 $300,000 983 1049 1090 1120 1145 1178
$300,000 or more 1228 1310 1361 1399 1429 1470
Supplement to J.K. Lasser’s Your Income Tax 2021 | 91