
Page 3 - Scanning for Time: Science and Art on a Photocopier
P. 3
photocopier! A pho- wave crest represents one full cycle of back and forth motion
tocopier is designed of the rubber band, but in a different location or moment in
to record stationary time.
flat objects. It doesn’t Each wave crest is equidistant, because the rubber band
work like your eye/ vibrates at a constant rate. You can hear the frequency or
brain system. It pitch of the plucked band. If you change the tension, length
doesn’t randomly Fig. 5. Harmonic waveform. or mass (thickness) of the rubber band, you change the fre-
scan a scene for im- quency or rate of back and forth motion and therefore the
portant locations and events and try to put everything in con- distance from wave to wave or wavelength. The scan bar is
text. A photocopier only records what it “sees” directly above moving from the region where you plucked it (antinode) to
the optical scan bar and that’s it. where you’re holding it (node), and the oscillation also natu-
A photocopier contains a host of elec- rally dampens with time. You can see the combined effect of
tronic and mechanical systems that all these two factors by the successive decrease in wave height. If
need to be in sync. After the start button is you listen, you may notice that the rubber band does indeed
pressed, a scanner or scan bar moves at a set get quieter over a short period of time. The vibration decays,
and constant rate beneath a glass bed. and the amplitude of each successive wave gets smaller and
When plucked, your rubber band really smaller. All this is seen because both phenomena, the moving
vibrates back and forth as a fundamental rubber band and the scan bar, take time.
harmonic waveform (1/2 wavelength), just A similar effect happens with
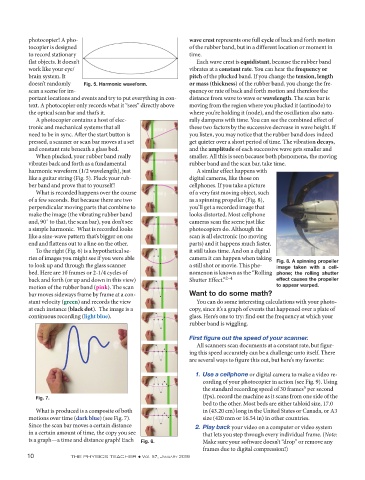
like a guitar string (Fig. 5). Pluck your rub- digital cameras, like those on
ber band and prove that to yourself! cellphones. If you take a picture
What is recorded happens over the course of a very fast moving object, such
of a few seconds. But because there are two as a spinning propeller (Fig. 8),
perpendicular moving parts that combine to you’ll get a recorded image that
make the image (the vibrating rubber band looks distorted. Most cellphone
and, 90˚ to that, the scan bar), you don’t see cameras scan the scene just like
a simple harmonic. What is recorded looks photocopiers do. Although the
like a sine-wave pattern that’s bigger on one scan is all electronic (no moving
end and flattens out to a line on the other. parts) and it happens much faster,
To the right (Fig. 6) is a hypothetical se- it still takes time. And on a digital
ries of images you might see if you were able camera it can happen when taking Fig. 8. A spinning propeller
to look up and through the glass scanner a still shot or movie. This phe- image taken with a cell-
bed. Here are 10 frames or 2-1/4 cycles of nomenon is known as the “Rolling phone; the rolling shutter
back and forth (or up and down in this view) Shutter Effect.” 2–4 effect causes the propeller
motion of the rubber band (pink). The scan to appear warped.
bar moves sideways frame by frame at a con- Want to do some math?
stant velocity (green) and records the view You can do some interesting calculations with your photo-
at each instance (black dot). The image is a copy, since it’s a graph of events that happened over a plate of
continuous recording (light blue). glass. Here’s one to try: find out the frequency at which your
rubber band is wiggling.
First figure out the speed of your scanner.
All scanners scan documents at a constant rate, but figur-
ing this speed accurately can be a challenge unto itself. There
are several ways to figure this out, but here’s my favorite:
1. Use a cellphone or digital camera to make a video re-
cording of your photocopier in action (see Fig. 9). Using
5
the standard recording speed of 30 frames per second
Fig. 7. (fps), record the machine as it scans from one side of the
bed to the other. Most beds are either tabloid size, 17.0
What is produced is a composite of both in (43.20 cm) long in the United States or Canada, or A3
motions over time (dark blue) (see Fig. 7). size (420 mm or 16.54 in) in other countries.
Since the scan bar moves a certain distance 2. Play back your video on a computer or video system
in a certain amount of time, the copy you see that lets you step through every individual frame. (Note:
is a graph—a time and distance graph! Each Fig. 6. Make sure your software doesn’t “drop” or remove any
frames due to digital compression!)
10 THE PHYSICS TEACHER ◆ Vol. 57, January 2019