
Page 36 - The Real Work Of Data Science Turning Data Into Information, Better Decisions, And Stronger Organizations by Ron S. Kenett, Thomas C. Redman (z-lib.org)_Neat
P. 36
22 The Real Work of Data Science
Many managers visited the company’s pro-
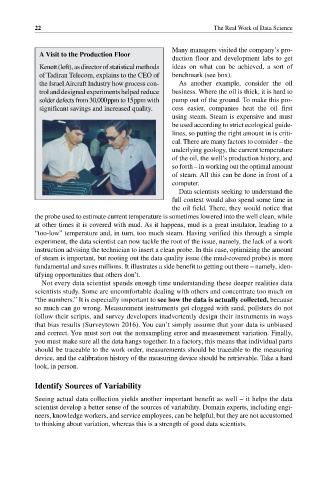
A Visit to the Production Floor
duction floor and development labs to get
Kenett (left), as director of statistical methods ideas on what can be achieved, a sort of
of Tadiran Telecom, explains to the CEO of benchmark (see box).
the Israel Aircraft Industry how process con- As another example, consider the oil
trol and designed experiments helped reduce business. Where the oil is thick, it is hard to
solder defects from 30,000 ppm to 15 ppm with pump out of the ground. To make this pro-
significant savings and increased quality. cess easier, companies heat the oil first
using steam. Steam is expensive and must
be used according to strict ecological guide-
lines, so putting the right amount in is criti-
cal. There are many factors to consider – the
underlying geology, the current temperature
of the oil, the well’s production history, and
so forth – in working out the optimal amount
of steam. All this can be done in front of a
computer.
Data scientists seeking to understand the
full context would also spend some time in
the oil field. There, they would notice that
the probe used to estimate current temperature is sometimes lowered into the well clean, while
at other times it is covered with mud. As it happens, mud is a great insulator, leading to a
“too‐low” temperature and, in turn, too much steam. Having verified this through a simple
experiment, the data scientist can now tackle the root of the issue, namely, the lack of a work
instruction advising the technician to insert a clean probe. In this case, optimizing the amount
of steam is important, but rooting out the data quality issue (the mud‐covered probe) is more
fundamental and saves millions. It illustrates a side benefit to getting out there – namely, iden-
tifying opportunities that others don’t.
Not every data scientist spends enough time understanding these deeper realities data
scientists study. Some are uncomfortable dealing with others and concentrate too much on
“the numbers.” It is especially important to see how the data is actually collected, because
so much can go wrong. Measurement instruments get clogged with sand, pollsters do not
follow their scripts, and survey developers inadvertently design their instruments in ways
that bias results (Surveytown 2016). You can’t simply assume that your data is unbiased
and correct. You must sort out the nonsampling error and measurement variation. Finally,
you must make sure all the data hangs together. In a factory, this means that individual parts
should be traceable to the work order, measurements should be traceable to the measuring
device, and the calibration history of the measuring device should be retrievable. Take a hard
look, in person.
Identify Sources of Variability
Seeing actual data collection yields another important benefit as well – it helps the data
scientist develop a better sense of the sources of variability. Domain experts, including engi-
neers, knowledge workers, and service employees, can be helpful, but they are not accustomed
to thinking about variation, whereas this is a strength of good data scientists.