
Page 41 - The Real Work Of Data Science Turning Data Into Information, Better Decisions, And Stronger Organizations by Ron S. Kenett, Thomas C. Redman (z-lib.org)_Neat
P. 41
28 The Real Work of Data Science
Even if time is short, scrub a small random sample (say, 1,000 records), making it as
pristine as you possibly can. Your goal is to arrive at a sample of data you know you can
trust. Employ all possible means of scrubbing and be ruthless! Eliminate erred data
records and data elements that you cannot correct, and mark data as “uncertain” when
applicable.
When you are done, take a hard look. When the scrubbing has gone really well (and
you’ll know it if it does), you’ve created a data set that rates high on the trustworthy scale.
It’s OK to move forward using this data. Sometimes the scrubbing is less satisfying. If
you’ve done the best you can, but still feel uncertain, put this data in the “use with cau-
tion” category. If the scrubbing goes poorly – for example, too many prices just look
wrong, and you can’t make corrections – you must rate this data, and all like it, as untrust-
worthy. The sample strongly suggests none of the data should be used in any analyses,
going forward.
After the initial scrub, move on to the second cleaning exercise: washing the remaining data
that was not in the scrubbing sample. Because scrubbing can be a time‐consuming, manual
process, the wash allows you to make corrections using more automatic processes. For
example, one wash technique involves “imputing” missing values by statistical means
(see Wikipedia 2018a). Multiple imputation is a statistical technique for analyzing incomplete
data sets, that is, data sets for which some entries are missing. Application of the technique
requires three steps: imputation, analysis, and pooling (Rubin 1987), An up‐to‐date account of
multiple imputation, as well as code and examples using the mice package in R, can be found
in van Buuren (2012). If the washing goes well, put this data into the “use with caution”
category.
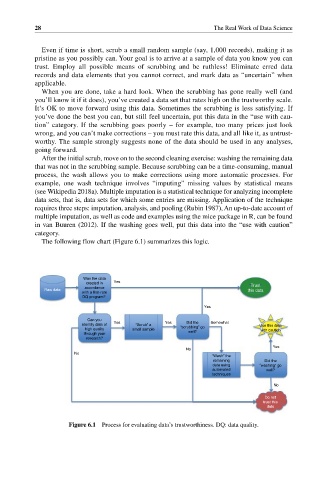
The following flow chart (Figure 6.1) summarizes this logic.
Was the data
created in Yes
accordance Trust
Raw data this data
with a first-rate
DQ program?
Yes
Can you
Did the
identify data of Yes “Scrub” a Yes “scrubbing” go Somewhat Use this data
high quality small sample with caution
through your well?
research?
Yes
No
No
“Wash” the
remaining Did the
data using “washing” go
automated well?
techniques
No
Do not
trust this
data
Figure 6.1 Process for evaluating data’s trustworthiness. DQ: data quality.