
Page 89 - The Real Work Of Data Science Turning Data Into Information, Better Decisions, And Stronger Organizations by Ron S. Kenett, Thomas C. Redman (z-lib.org)_Neat
P. 89
80 The Real Work of Data Science
maturity level, which we call learning and discovery. The opportunities are enormous,
including personalized medicine, optimized maintenance, data‐driven decision‐making, and
so forth.
Very savvy data scientists are needed. For example, a data scientist may harvest data from
social media and integrate it with operational reports to produce deep insights and establish
causal relationships. But is the social media data biased because of self‐selection? What roles
can A/B tests play? What is the nature of statistical inference when the data sets are so large?
And, most critically, how does data science drive business strategy? Data scientists need to
answer such questions.
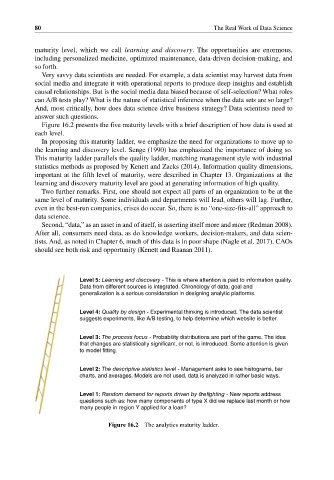
Figure 16.2 presents the five maturity levels with a brief description of how data is used at
each level.
In proposing this maturity ladder, we emphasize the need for organizations to move up to
the learning and discovery level. Senge (1990) has emphasized the importance of doing so.
This maturity ladder parallels the quality ladder, matching management style with industrial
statistics methods as proposed by Kenett and Zacks (2014). Information quality dimensions,
important at the fifth level of maturity, were described in Chapter 13. Organizations at the
learning and discovery maturity level are good at generating information of high quality.
Two further remarks. First, one should not expect all parts of an organization to be at the
same level of maturity. Some individuals and departments will lead, others will lag. Further,
even in the best‐run companies, crises do occur. So, there is no “one‐size‐fits‐all” approach to
data science.
Second, “data,” as an asset in and of itself, is asserting itself more and more (Redman 2008).
After all, consumers need data, as do knowledge workers, decision‐makers, and data scien-
tists. And, as noted in Chapter 6, much of this data is in poor shape (Nagle et al. 2017). CAOs
should see both risk and opportunity (Kenett and Raanan 2011).
Level 5: Learning and discovery - This is where attention is paid to information quality.
Data from different sources is integrated. Chronology of data, goal and
generalization is a serious consideration in designing analytic platforms.
Level 4: Quality by design - Experimental thinking is introduced. The data scientist
suggests experiments, like A/B testing, to help determine which website is better.
Level 3: The process focus - Probability distributions are part of the game. The idea
that changes are statistically signi cant, or not, is introduced. Some attention is given
to model tting.
Level 2: The descriptive statistics level - Management asks to see histograms, bar
charts, and averages. Models are not used, data is analyzed in rather basic ways.
Level 1: Random demand for reports driven by re ghting - New reports address
questions such as: how many components of type X did we replace last month or how
many people in region Y applied for a loan?
Figure 16.2 The analytics maturity ladder.