
Page 721 - The Toxicology of Fishes
P. 721
Biomarkers 701
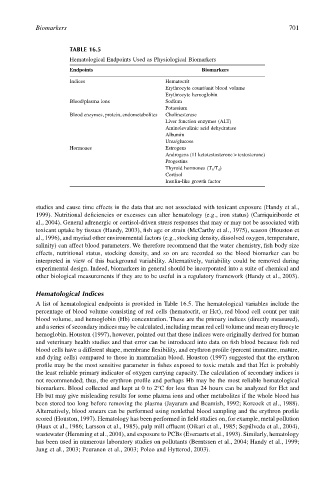
TABLE 16.5
Hematological Endpoints Used as Physiological Biomarkers
Endpoints Biomarkers
Indices Hematocrit
Erythrocyte count/unit blood volume
Erythrocyte hemoglobin
Blood/plasma ions Sodium
Potassium
Blood enzymes, protein, endometabolites Cholinesterase
Liver function enzymes (ALT)
Aminolevulinic acid dehydratase
Albumin
Urea/glucose
Hormones Estrogens
Androgens (11 ketotestosterone > testosterone)
Progestins
Thyroid hormones (T 3 /T 4 )
Cortisol
Insulin-like growth factor
studies and cause time effects in the data that are not associated with toxicant exposure (Handy et al.,
1999). Nutritional deficiencies or excesses can alter hematology (e.g., iron status) (Carriquiriborde et
al., 2004). General adrenergic or cortisol-driven stress responses that may or may not be associated with
toxicant uptake by tissues (Handy, 2003), fish age or strain (McCarthy et al., 1975), season (Houston et
al., 1996), and myriad other environmental factors (e.g., stocking density, dissolved oxygen, temperature,
salinity) can affect blood parameters. We therefore recommend that the water chemistry, fish body size
effects, nutritional status, stocking density, and so on are recorded so the blood biomarker can be
interpreted in view of this background variability. Alternatively, variability could be removed during
experimental design. Indeed, biomarkers in general should be incorporated into a suite of chemical and
other biological measurements if they are to be useful in a regulatory framework (Handy et al., 2003).
Hematological Indices
A list of hematological endpoints is provided in Table 16.5. The hematological variables include the
percentage of blood volume consisting of red cells (hematocrit, or Hct), red blood cell count per unit
blood volume, and hemoglobin (Hb) concentration. These are the primary indices (directly measured),
and a series of secondary indices may be calculated, including mean red cell volume and mean erythrocyte
hemoglobin. Houston (1997), however, pointed out that these indices were originally derived for human
and veterinary health studies and that error can be introduced into data on fish blood because fish red
blood cells have a different shape, membrane flexibility, and erythron profile (percent immature, mature,
and dying cells) compared to those in mammalian blood. Houston (1997) suggested that the erythron
profile may be the most sensitive parameter in fishes exposed to toxic metals and that Hct is probably
the least reliable primary indicator of oxygen carrying capacity. The calculation of secondary indices is
not recommended; thus, the erythron profile and perhaps Hb may be the most reliable hematological
biomarkers. Blood collected and kept at 0 to 2°C for less than 24 hours can be analyzed for Hct and
Hb but may give misleading results for some plasma ions and other metabolites if the whole blood has
been stored too long before removing the plasma (Jayaram and Beamish, 1992; Korcock et al., 1988).
Alternatively, blood smears can be performed using nonlethal blood sampling and the erythron profile
scored (Houston, 1997). Hematology has been performed in field studies on, for example, metal pollution
(Haux et al., 1986; Larsson et al., 1985), pulp mill effluent (Oikari et al., 1985; Sepúlveda et al., 2004),
wastewater (Hemming et al., 2001), and exposure to PCBs (Everaarts et al., 1993). Similarly, hematology
has been used in numerous laboratory studies on pollutants (Berntssen et al., 2004; Handy et al., 1999;
Jung et al., 2003; Peuranen et al., 2003; Poleo and Hytterod, 2003).