Page 79 - The Toxicology of Fishes
P. 79

Toxicokinetics in Fishes                                                     59


                            TABLE 3.1 (cont.)
                            Generalized Structural, Functional, and Environmental Differences between Fish and Mammals
                            Characteristic                 Fish                   Mammals
                            Lymphatics             No                    Yes
                            Secondary circulation  Yes                   No
                            Blood pressure and flow  Low                  High
                            Red blood cells        Nucleated             Non-nucleated
                            Plasma proteins        Lower levels          Higher levels
                            Blood pH               Higher that mammals   Lower than fish
                            Kidney
                            Nephron                Less complex. SW—no distal   More complex, including glomerulus,
                                                   tubule; aglomerular. FW,   distal tubule and loop of Henle
                                                   SW—modified loop of Henle
                            Blood supply           Renal artery and renal portal  Renal artery
                            Hematopoiesis          Many fishes            NA
                            Waste excretion        Minor site            Primary site
                            Fluid balance          Primary site          Primary site
                            Ion balance            Secondary site        Primary site
                            Acid–base balance      Secondary site        Primary site
                            Liver
                            Functional unit        Tubule, with no triads or zonal   Lobule, with triads and zonal
                                                   relationships          arrangement
                            Gallbladder            May or may not be present  May or may not be present
                            Bile flow               Slower than mammals   Faster than fish
                            Biotransformation rates  Slower than mammals  Faster than fish
                            Gastrointestinal tract
                            Structural divisions   Gradual transitions   Clear delineations
                            Gastric stomach        Absent in 15% of species  Present
                            Absorptive surface     Longitudinal folds    Villi
                            Lipid absorption       Primarily into blood  Size dependent into lymph
                            Change in temperature  Change in length/morphology  NA
                            Skin
                            Epidermis              Living, moist         Dead, dry, keritinized
                            Mucous                 Present               Absent


                                                     Intraperitoneal
                                         Feces                       Kidney  Bladder  Urine

                                                                     Renal
                                       Gastointestinal
                                          Tract                      Portal
                                                                                Intramuscular
                                              Hepatic                Muscle
                                               Portal
                                                           Fat
                                        Bile   Liver                    Skin       Internal
                                                         Blood                    Surfaces

                                                         Secondary
                                                         Circulation

                                                        Gill         Water
                                  Ingestion  Intravenous  Inhalation    Dermal
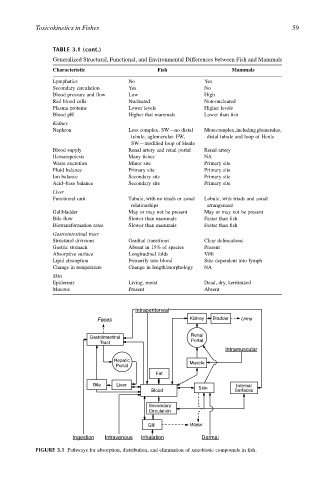
                       FIGURE 3.1 Pathways for absorption, distribution, and elimination of xenobiotic compounds in fish.
   74   75   76   77   78   79   80   81   82   83   84