
Page 46 - The Welfare of Cattle
P. 46
daIrY and beef sustaInabILItY 23
the production cycle on intensively managed feedlots. A debate continues on whether extensive or
intensive production systems are more sustainable (Capper 2012).
The primary driving factor in the global movement toward more intensive livestock production
is a declining profit margin. Input costs have increased greater than the wholesale/retail price paid
for the marketable meat, milk, and eggs. However, consumers with ample dispensable income have
facilitated the growth of organic and non-GMO production of beef and dairy products which gener-
ally use more extensive systems.
One of the most effective ways to increase efficiency is to increase the number of cows per
unit of land (Rotz et al., 1999). This approach is not without consequences as nutrient import and
accumulation in soils often occurs on farms with increased animal density (Harrison et al., 2007).
Imported nutrients come in purchased feed, which may be transported long distances making it
impractical and uneconomical to return the manure nutrients to the land producing the crops. An
accumulation of nutrients on-farm can lead to greater movement of nutrients off farm via air and
water resulting in degradation of water and air (Harrison et al., 2007).
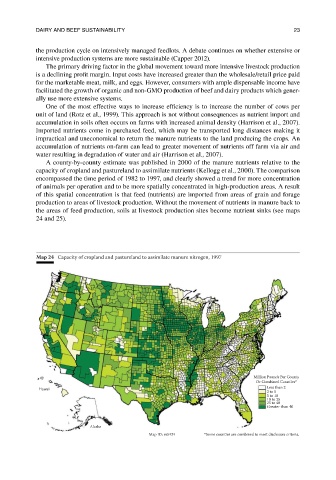
A county-by-county estimate was published in 2000 of the manure nutrients relative to the
capacity of cropland and pastureland to assimilate nutrients (Kellogg et al., 2000). The comparison
encompassed the time period of 1982 to 1997, and clearly showed a trend for more concentration
of animals per operation and to be more spatially concentrated in high-production areas. A result
of this spatial concentration is that feed (nutrients) are imported from areas of grain and forage
production to areas of livestock production. Without the movement of nutrients in manure back to
the areas of feed production, soils at livestock production sites become nutrient sinks (see maps
24 and 25).
Map 24 Capacity of cropland and pastureland to assimilate manure nitrogen, 1997
Million Pounds Per County
Or Combined Counties*
Hawaii Less than 2
2 to 5
5 to 10
10 to 25
25 to 40
Greater than 40
Alaska
Map ID: m5434 *Some counties are combined to meet disclosure criteria.