
Page 41 - The Welfare of Cattle
P. 41
18 the WeLfare of CattLe
six percent of both the milk and the cows. Finally, Africa has a significant 21 percent of milked
cows in the world but only five percent of the milk production. Density varies widely across the
continent with much of the milking herd in East Africa. Nonetheless, low productivity in terms of
milk production means that per capita consumption is low despite significant imports.
International trade in milk is mainly in dry products. About ten percent of milk production is
traded. Big exporting regions include Europe, Oceania, and North America. The big importing
regions are East and Southeast Asia and Africa. Europe and North America have importing and
exporting nations and trade high-priced dairy products among themselves even though both regions
are major net exporters. Africa is a major dairy import region. Overall, Europe, North America and
Oceania account for about 85 percent of dairy exports and African and other low income regions
account for about 80 percent of dairy imports. But, of course, the poorest countries participate in
little of this trade accounting for only about six percent of world dairy imports. Trade barriers, pro-
duction subsidies, and production quotas, which used to severely distort world dairy trade, still have
impacts, but are much less influential in recent years.
DIStrIBUtION OF BOVINe Meat PrODUCtION aND traDe
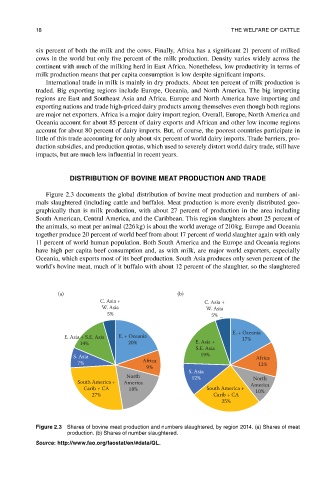
Figure 2.3 documents the global distribution of bovine meat production and numbers of ani-
mals slaughtered (including cattle and buffalo). Meat production is more evenly distributed geo-
graphically than is milk production, with about 27 percent of production in the area including
South American, Central America, and the Caribbean. This region slaughters about 25 percent of
the animals, so meat per animal (226 kg) is about the world average of 210 kg. Europe and Oceania
together produce 20 percent of world beef from about 17 percent of world slaughter again with only
11 percent of world human population. Both South America and the Europe and Oceania regions
have high per capita beef consumption and, as with milk, are major world exporters, especially
Oceania, which exports most of its beef production. South Asia produces only seven percent of the
world’s bovine meat, much of it buffalo with about 12 percent of the slaughter, so the slaughtered
(a) (b)
C. Asia + C. Asia +
W. Asia W. Asia
5% 5%
E. + Oceania
E. Asia + S.E. Asia E. + Oceania 17%
14% 20% E. Asia +
S.E. Asia
S. Asia 19% Africa
7% Africa 12%
9%
S. Asia
North 12% North
South America + America America
Carib + CA 18% South America + 10%
27% Carib + CA
25%
Figure 2.3 shares of bovine meat production and numbers slaughtered, by region 2014. (a) shares of meat
production. (b) shares of number slaughtered.
Source: http://www.fao.org/faostat/en/#data/QL.