
Page 40 - The Welfare of Cattle
P. 40
eConoMICs of GLobaL CattLe IndustrIes 17
America and Caribbean. Africa has a large cattle herd comprising almost 20 percent of the world
total. East and South East Asia, with about one-third the global human population, have about 13
percent of bovines on farms. Europe has about eight percent and Oceania (with a tiny human popu-
lation) has about two percent of bovines. (Despite geographic separation, in our data discussion,
we put the small region of Oceania together with Europe since both have highly developed cattle
industries and Oceania is quite small separately.) North America has another six percent of bovines,
which is less than its nine percent share of human population. Thus, cattle tend to be where people
are, except that South America and Oceania have a much larger share of cattle than people.
DIStrIBUtION OF MILK PrODUCtION aND traDe
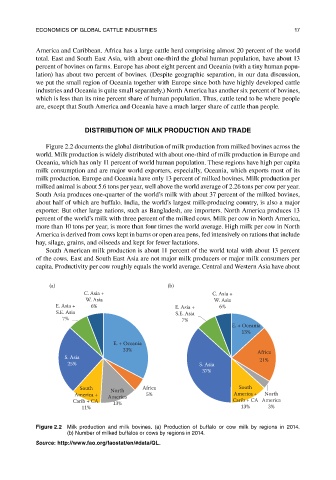
Figure 2.2 documents the global distribution of milk production from milked bovines across the
world. Milk production is widely distributed with about one-third of milk production in Europe and
Oceania, which has only 11 percent of world human population. These regions have high per capita
milk consumption and are major world exporters, especially, Oceania, which exports most of its
milk production. Europe and Oceania have only 13 percent of milked bovines. Milk production per
milked animal is about 5.6 tons per year, well above the world average of 2.26 tons per cow per year.
South Asia produces one-quarter of the world’s milk with about 37 percent of the milked bovines,
about half of which are buffalo. India, the world’s largest milk-producing country, is also a major
exporter. But other large nations, such as Bangladesh, are importers. North America produces 13
percent of the world’s milk with three percent of the milked cows. Milk per cow in North America,
more than 10 tons per year, is more than four times the world average. High milk per cow in North
America is derived from cows kept in barns or open area pens, fed intensively on rations that include
hay, silage, grains, and oilseeds and kept for fewer lactations.
South American milk production is about 11 percent of the world total with about 13 percent
of the cows. East and South East Asia are not major milk producers or major milk consumers per
capita. Productivity per cow roughly equals the world average. Central and Western Asia have about
(a) (b)
C. Asia + C. Asia +
W. Asia W. Asia
E. Asia + 6% E. Asia + 6%
S.E. Asia S.E. Asia
7% 7%
E. + Oceania
13%
E. + Oceania
33% Africa
S. Asia 21%
25% S. Asia
37%
South North Africa South
America + America 5% America + North
Carib + CA 13% Carib + CA America
11% 13% 3%
Figure 2.2 Milk production and milk bovines. (a) Production of buffalo or cow milk by regions in 2014.
(b) number of milked buffalos or cows by regions in 2014.
Source: http://www.fao.org/faostat/en/#data/QL.