
Page 58 - The Welfare of Cattle
P. 58
MICrobIaL PathoGens 35
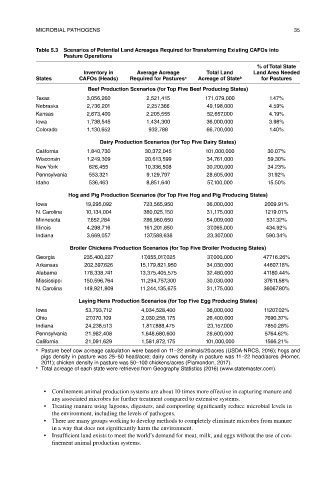
table 5.3 Scenarios of Potential Land acreages required for transforming existing CaFOs into
Pasture Operations
% of total State
Inventory in average acreage total Land Land area Needed
States CaFOs (heads) required for Pastures a acreage of State b for Pastures
Beef Production Scenarios (for top Five Beef Producing States)
texas 3,056,260 2,521,415 171,079,000 1.47%
nebraska 2,736,201 2,257,366 49,198,000 4.59%
Kansas 2,673,400 2,205,555 52,657,000 4.19%
Iowa 1,738,545 1,434,300 36,000,000 3.98%
Colorado 1,130,652 932,788 66,700,000 1.40%
Dairy Production Scenarios (for top Five Dairy States)
California 1,840,730 30,372,045 101,000,000 30.07%
Wisconsin 1,249,309 20,613,599 34,761,000 59.30%
new York 626,455 10,336,508 30,200,000 34.23%
Pennsylvania 553,321 9,129,797 28,605,000 31.92%
Idaho 536,463 8,851,640 57,100,000 15.50%
hog and Pig Production Scenarios (for top Five hog and Pig Producing States)
Iowa 19,295,092 723,565,950 36,000,000 2009.91%
n. Carolina 10,134,004 380,025,150 31,175,000 1219.01%
Minnesota 7,652,284 286,960,650 54,009,000 531.32%
Illinois 4,298,716 161,201,850 37,065,000 434.92%
Indiana 3,669,057 137,589,638 23,307,000 590.34%
Broiler Chickens Production Scenarios (for top Five Broiler Producing States)
Georgia 235,400,227 17,655,017,025 37,000,000 47716.26%
arkansas 202,397,626 15,179,821,950 34,030,000 44607.18%
alabama 178,338,741 13,375,405,575 32,480,000 41180.44%
Mississippi 150,596,764 11,294,757,300 30,030,000 37611.58%
n. Carolina 149,921,809 11,244,135,675 31,175,000 36067.80%
Laying hens Production Scenarios (for top Five egg Producing States)
Iowa 53,793,712 4,034,528,400 36,000,000 11207.02%
ohio 27,070,109 2,030,258,175 26,400,000 7690.37%
Indiana 24,238,513 1,817,888,475 23,157,000 7850.28%
Pennsylvania 21,982,408 1,648,680,600 28,600,000 5764.62%
California 21,091,629 1,581,872,175 101,000,000 1566.21%
a Pasture beef cow acreage calculation were based on 11–22 animals/20 acres (usda-nrCs, 2016); hogs and
pigs density in pasture was 25–50 head/acre; dairy cows density in pasture was 11–22 head/acres (horner,
2011); chicken density in pasture was 50–100 chickens/acres (Plamondon, 2017).
b total acreage of each state were retrieved from Geography statistics (2016) (www.statemaster.com).
• Confinement animal production systems are about 10 times more effective in capturing manure and
any associated microbes for further treatment compared to extensive systems.
• Treating manure using lagoons, digesters, and composting significantly reduce microbial levels in
the environment, including the levels of pathogens.
• There are many groups working to develop methods to completely eliminate microbes from manure
in a way that does not significantly harm the environment.
• Insufficient land exists to meet the world’s demand for meat, milk, and eggs without the use of con-
finement animal production systems.