
Page 1188 - Veterinary Toxicology, Basic and Clinical Principles, 3rd Edition
P. 1188
1120 SECTION | XVII Analytical Toxicology
VetBooks.ir metals and/or trace elements at relatively low prices. These still a valuable technique for a fast low-level analysis of
certain single elements.
tests are commonly performed on serum, plasma, blood, or
liver tissue (including liver biopsy samples) but are also
run on many other types of samples, from feed to feathers. Inductively Coupled Plasma Coupled Optical
Both the sample preparation and analysis steps are usually
Emission Spectrometry (ICP-OES, or just ICP)
done quickly and efficiently, resulting in short turnaround
This technique is similar to AA in that it also involves
times. The techniques that are commonly used for the anal-
ysis of elemental species are as follow. atomization of the sample, but in the case of ICP, it’s the
emission of light that’s measured rather than the absor-
bance. In ICP, thermal energy excites the atoms to a high-
Atomic Absorption Spectroscopy er energy state. When the atoms relax to a lower state,
(abbreviated as AAS or AA) they emit light at a frequency specific to the element. The
thermal energy is supplied by a torch in which argon is
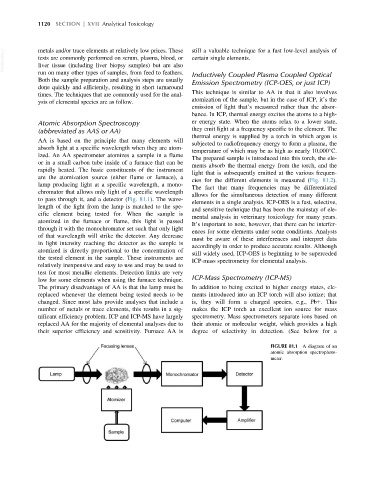
AA is based on the principle that many elements will
subjected to radiofrequency energy to form a plasma, the
absorb light at a specific wavelength when they are atom-
temperature of which may be as high as nearly 10,000 C.
ized. An AA spectrometer atomizes a sample in a flame
The prepared sample is introduced into this torch, the ele-
or in a small carbon tube inside of a furnace that can be
ments absorb the thermal energy from the torch, and the
rapidly heated. The basic constituents of the instrument
light that is subsequently emitted at the various frequen-
are the atomization source (either flame or furnace), a
cies for the different elements is measured (Fig. 81.2).
lamp producing light at a specific wavelength, a mono-
The fact that many frequencies may be differentiated
chromator that allows only light of a specific wavelength
allows for the simultaneous detection of many different
to pass through it, and a detector (Fig. 81.1). The wave-
elements in a single analysis. ICP-OES is a fast, selective,
length of the light from the lamp is matched to the spe-
and sensitive technique that has been the mainstay of ele-
cific element being tested for. When the sample is
mental analysis in veterinary toxicology for many years.
atomized in the furnace or flame, this light is passed
It’s important to note, however, that there can be interfer-
through it with the monochromator set such that only light
ences for some elements under some conditions. Analysts
of that wavelength will strike the detector. Any decrease
must be aware of these interferences and interpret data
in light intensity reaching the detector as the sample is
accordingly in order to produce accurate results. Although
atomized is directly proportional to the concentration of
still widely used, ICP-OES is beginning to be superceded
the tested element in the sample. These instruments are
ICP-mass spectrometry for elemental analysis.
relatively inexpensive and easy to use and may be used to
test for most metallic elements. Detection limits are very
low for some elements when using the furnace technique. ICP-Mass Spectrometry (ICP-MS)
The primary disadvantage of AA is that the lamp must be In addition to being excited to higher energy states, ele-
replaced whenever the element being tested needs to be ments introduced into an ICP torch will also ionize; that
changed. Since most labs provide analyses that include a is, they will form a charged species, e.g., Pb1.This
number of metals or trace elements, this results in a sig- makes the ICP torch an excellent ion source for mass
nificant efficiency problem. ICP and ICP-MS have largely spectrometry. Mass spectrometers separate ions based on
replaced AA for the majority of elemental analyses due to their atomic or molecular weight, which provides a high
their superior efficiency and sensitivity. Furnace AA is degree of selectivity in detection. (See below for a
FIGURE 81.1 A diagram of an
atomic absorption spectrophoto-
meter.