
Page 1192 - Veterinary Toxicology, Basic and Clinical Principles, 3rd Edition
P. 1192
1124 SECTION | XVII Analytical Toxicology
VetBooks.ir
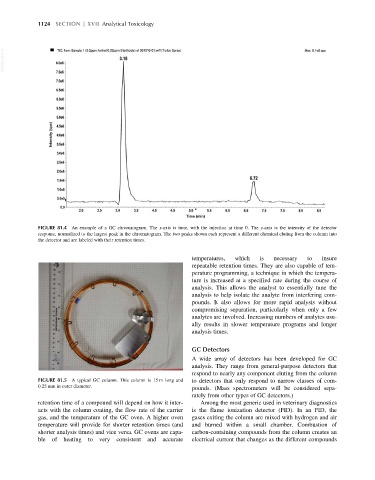
FIGURE 81.4 An example of a GC chromatogram. The x-axis is time, with the injection at time 0. The y-axis is the intensity of the detector
response, normalized to the largest peak in the chromatogram. The two peaks shown each represent a different chemical eluting from the column into
the detector and are labeled with their retention times.
temperatures, which is necessary to insure
repeatable retention times. They are also capable of tem-
perature programming, a technique in which the tempera-
ture is increased at a specified rate during the course of
analysis. This allows the analyst to essentially tune the
analysis to help isolate the analyte from interfering com-
pounds. It also allows for more rapid analysis without
compromising separation, particularly when only a few
analytes are involved. Increasing numbers of analytes usu-
ally results in slower temperature programs and longer
analysis times.
GC Detectors
A wide array of detectors has been developed for GC
analysis. They range from general-purpose detectors that
respond to nearly any component eluting from the column
FIGURE 81.5 A typical GC column. This column is 15 m long and to detectors that only respond to narrow classes of com-
0.25 mm in outer diameter.
pounds. (Mass spectrometers will be considered sepa-
rately from other types of GC detectors.)
retention time of a compound will depend on how it inter- Among the most generic used in veterinary diagnostics
acts with the column coating, the flow rate of the carrier is the flame ionization detector (FID). In an FID, the
gas, and the temperature of the GC oven. A higher oven gases exiting the column are mixed with hydrogen and air
temperature will provide for shorter retention times (and and burned within a small chamber. Combustion of
shorter analysis times) and vice versa. GC ovens are capa- carbon-containing compounds from the column creates an
ble of heating to very consistent and accurate electrical current that changes as the different compounds