
Page 1195 - Veterinary Toxicology, Basic and Clinical Principles, 3rd Edition
P. 1195
Analytical Toxicology and Sample Submission Requirements Chapter | 81 1127
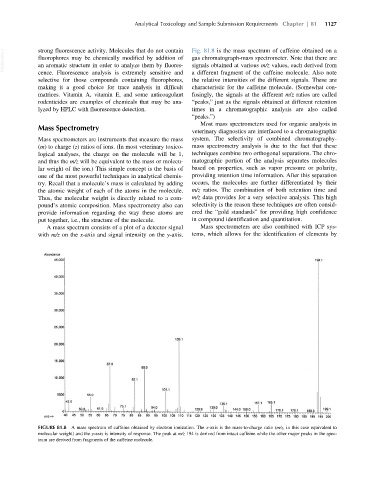
VetBooks.ir strong fluorescence activity. Molecules that do not contain Fig. 81.8 is the mass spectrum of caffeine obtained on a
gas chromatograph-mass spectrometer. Note that there are
fluorophores may be chemically modified by addition of
an aromatic structure in order to analyze them by fluores-
signals obtained at various m/z values, each derived from
cence. Fluorescence analysis is extremely sensitive and a different fragment of the caffeine molecule. Also note
selective for those compounds containing fluorophores, the relative intensities of the different signals. These are
making it a good choice for trace analysis in difficult characteristic for the caffeine molecule. (Somewhat con-
matrices. Vitamin A, vitamin E, and some anticoagulant fusingly, the signals at the different m/z ratios are called
rodenticides are examples of chemicals that may be ana- “peaks,” just as the signals obtained at different retention
lyzed by HPLC with fluorescence detection. times in a chromatographic analysis are also called
“peaks.”)
Most mass spectrometers used for organic analysis in
Mass Spectrometry
veterinary diagnostics are interfaced to a chromatographic
Mass spectrometers are instruments that measure the mass system. The selectivity of combined chromatography-
(m) to charge (z) ratios of ions. (In most veterinary toxico- mass spectrometry analysis is due to the fact that these
logical analyses, the charge on the molecule will be 1, techniques combine two orthogonal separations. The chro-
and thus the m/z will be equivalent to the mass or molecu- matographic portion of the analysis separates molecules
lar weight of the ion.) This simple concept is the basis of based on properties, such as vapor pressure or polarity,
one of the most powerful techniques in analytical chemis- providing retention time information. After this separation
try. Recall that a molecule’s mass is calculated by adding occurs, the molecules are further differentiated by their
the atomic weight of each of the atoms in the molecule. m/z ratios. The combination of both retention time and
Thus, the molecular weight is directly related to a com- m/z data provides for a very selective analysis. This high
pound’s atomic composition. Mass spectrometry also can selectivity is the reason these techniques are often consid-
provide information regarding the way these atoms are ered the “gold standards” for providing high confidence
put together, i.e., the structure of the molecule. in compound identification and quantitation.
A mass spectrum consists of a plot of a detector signal Mass spectrometers are also combined with ICP sys-
with m/z on the x-axis and signal intensity on the y-axis. tems, which allows for the identification of elements by
FIGURE 81.8 A mass spectrum of caffeine obtained by electron ionization. The x-axis is the mass-to-charge ratio (m/z, in this case equivalent to
molecular weight) and the y-axis is intensity of response. The peak at m/z 194 is derived from intact caffeine while the other major peaks in the spec-
trum are derived from fragments of the caffeine molecule.