
Page 59 - Small Animal Internal Medicine, 6th Edition
P. 59
CHAPTER 2 Diagnostic Tests for the Cardiovascular System 31
VetBooks.ir
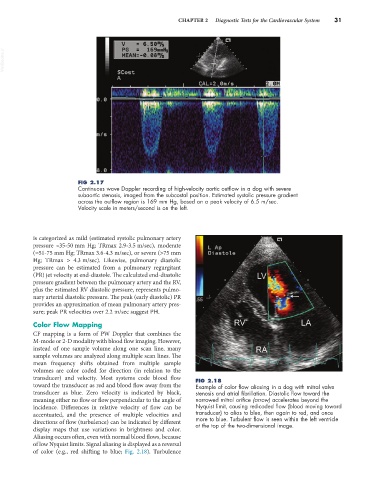
FIG 2.17
Continuous wave Doppler recording of high-velocity aortic outflow in a dog with severe
subaortic stenosis, imaged from the subcostal position. Estimated systolic pressure gradient
across the outflow region is 169 mm Hg, based on a peak velocity of 6.5 m/sec.
Velocity scale in meters/second is on the left.
is categorized as mild (estimated systolic pulmonary artery
pressure ≈35-50 mm Hg; TRmax 2.9-3.5 m/sec), moderate
(≈51-75 mm Hg; TRmax 3.6-4.3 m/sec), or severe (>75 mm
Hg; TRmax > 4.3 m/sec). Likewise, pulmonary diastolic
pressure can be estimated from a pulmonary regurgitant
(PR) jet velocity at end-diastole. The calculated end-diastolic
pressure gradient between the pulmonary artery and the RV,
plus the estimated RV diastolic pressure, represents pulmo-
nary arterial diastolic pressure. The peak (early diastolic) PR
provides an approximation of mean pulmonary artery pres-
sure; peak PR velocities over 2.2 m/sec suggest PH.
Color Flow Mapping
CF mapping is a form of PW Doppler that combines the
M-mode or 2-D modality with blood flow imaging. However,
instead of one sample volume along one scan line, many
sample volumes are analyzed along multiple scan lines. The
mean frequency shifts obtained from multiple sample
volumes are color coded for direction (in relation to the
transducer) and velocity. Most systems code blood flow FIG 2.18
toward the transducer as red and blood flow away from the Example of color flow aliasing in a dog with mitral valve
transducer as blue. Zero velocity is indicated by black, stenosis and atrial fibrillation. Diastolic flow toward the
meaning either no flow or flow perpendicular to the angle of narrowed mitral orifice (arrow) accelerates beyond the
incidence. Differences in relative velocity of flow can be Nyquist limit, causing red-coded flow (blood moving toward
accentuated, and the presence of multiple velocities and transducer) to alias to blue, then again to red, and once
directions of flow (turbulence) can be indicated by different more to blue. Turbulent flow is seen within the left ventricle
at the top of the two-dimensional image.
display maps that use variations in brightness and color.
Aliasing occurs often, even with normal blood flows, because
of low Nyquist limits. Signal aliasing is displayed as a reversal
of color (e.g., red shifting to blue; Fig. 2.18). Turbulence