Page 44 - 2022 Annual Report 2022 01.18 0528
P. 44

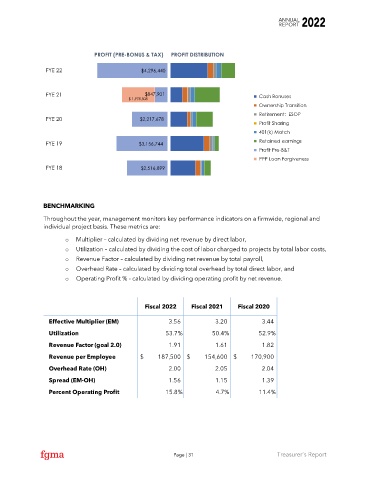
PROFIT (PRE-BONUS & TAX)     PROFIT DISTRIBUTION


                 FYE 22                         $4,296,440


                 FYE 21                          $847,901                              Cash Bonuses
                                            $ 1,978,508
                                                                                       Ownership Transition
                                                                                       Retirement:  ESOP
                 FYE 20                        $2,217,678
                                                                                       Profit Sharing
                                                                                       401(k) Match

                 FYE 19                        $3,156,744                              Retained earnings
                                                                                       Profit Pre-B&T
                                                                                       PPP Loan Forgiveness
                 FYE 18                         $2,516,899


               BENCHMARKING
               Throughout the year, management monitors key performance indicators on a firmwide, regional and
               individual project basis. These metrics are:

                       o  Multiplier – calculated by dividing net revenue by direct labor,
                       o  Utilization – calculated by dividing the cost of labor charged to projects by total labor costs,
                       o  Revenue Factor – calculated by dividing net revenue by total payroll,
                       o  Overhead Rate – calculated by dividing total overhead by total direct labor, and
                       o  Operating Profit % - calculated by dividing operating profit by net revenue.


                                                 Fiscal 2022    Fiscal 2021     Fiscal 2020


                 Effective Multiplier (EM)                             3.56                          3.20                        3.44

                 Utilization                            53.7%          50.4%           52.9%
                 Revenue Factor (goal 2.0)               1.91           1.61            1.82

                 Revenue per Employee          $            187,500  $            154,600  $            170,900

                 Overhead Rate (OH)                                    2.00                          2.05                        2.04
                 Spread (EM-OH)                                        1.56                        1.15                          1.39

                 Percent Operating Profit               15.8%           4.7%           11.4%


                                                          Page | 31                          Treasurer’s Report
   39   40   41   42   43   44   45   46   47   48   49