Page 60 - 2016 FGM Annual Report
P. 60

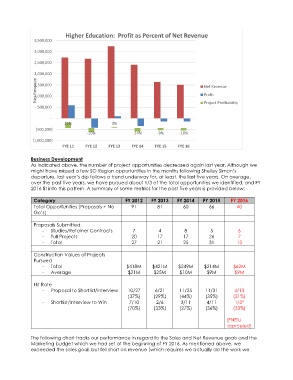
Higher Education:  Profit as Percent of Net Revenue
                3,500,000

                3,000,000

                2,500,000

                2,000,000
                Net Revenue
                1,500,000                                                             Net Revenue
                1,000,000                                                             Profit

                 500,000                                                              Project Profitability

                       -
                            22%                 3%
                 (500,000)
                                     -16%                -14%      -9%      -10%
               (1,000,000)
                           FYE 11    FYE 12   FYE 13    FYE 14    FYE 15   FYE 16

              Business Development
              As indicated above, the number of project opportunities decreased again last year. Although we
              might have missed a few SO Region opportunities in the months following Shelley Simon’s
              departure, last year’s dip follows a trend underway for, at least, the last five years. On average,
              over the past five years, we have pursued about 1/3 of the total opportunities we identified, and FY
              2016 fit into this pattern. A summary of some metrics for the past five years is provided below:

               Category                              FY 2012    FY 2013    FY 2014    FY 2015    FY 2016
               Total Opportunities (Proposals + No      91         81         60        66          40
               Go’s)

               Proposals Submitted
                   -   Studies/Retainer Contracts       7          4          8          5           6
                   -   Full Projects                    20         17         17        26           7
                   -   Total                            27         21         25        31          13

               Construction Values of Projects
               Pursued
                   -   Total                          $418M      $421M      $249M     $214M       $62M
                   -   Average                        $21M       $25M       $10M       $9M         $9M

               Hit Rate
                   -   Proposal to Shortlist/Interview   10/27    6/21      11/25      11/31       4/13
                                                      (37%)      (29%)      (44%)      (35%)      (31%)
                   -   Shortlist/Interview to Win      7/10       2/6        3/11      4/11        1/3*
                                                      (70%)      (33%)      (27%)      (36%)      (33%)

                                                                                                [*NEIU
                                                                                                canceled]

              The following chart tracks our performance in regard to the Sales and Net Revenue goals and the
              Marketing budget which we had set at the beginning of FY 2016. As mentioned above, we
              exceeded the sales goal, but fell short on revenue (which requires we actually do the work we
   55   56   57   58   59   60   61   62   63   64   65