
Page 61 - 2016 FGM Annual Report
P. 61
have sold). Anticipating a limited number of opportunities, we had dropped our marketing budget
significantly over the marketing costs of the previous year. While we did spend much less on
marketing compared to FY 2015, we exceeded our budget by about $55,000. The majority of this
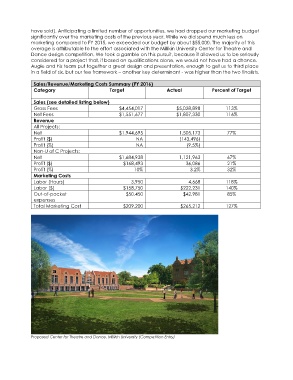
overage is attributable to the effort associated with the Millikin University Center for Theatre and
Dance design competition. We took a gamble on this pursuit, because it allowed us to be seriously
considered for a project that, if based on qualifications alone, we would not have had a chance.
Augie and his team put together a great design and presentation, enough to get us to third place
in a field of six, but our fee framework – another key determinant - was higher than the two finalists.
Sales/Revenue/Marketing Costs Summary (FY 2016)
Category Target Actual Percent of Target
Sales (see detailed listing below)
Gross Fees $4,454,017 $5,028,898 113%
Net Fees $1,551,677 $1,807,330 116%
Revenue
All Projects:
Net $1,944,695 1,505,173 77%
Profit ($) NA (143,496)
Profit (%) NA (9.5%)
Non-U of C Projects:
Net $1,684,938 1,121,963 67%
Profit ($) $168,493 36,086 21%
Profit (%) 10% 3.2% 32%
Marketing Costs
Labor (Hours) 3,950 4,668 118%
Labor ($) $158,750 $222,231 140%
Out-of-pocket $50,450 $42,981 85%
expenses
Total Marketing Cost $209,200 $265,212 127%
Proposed Center for Theatre and Dance, Millikin University (Competition Entry)