Page 41 - 2022 Annual Report 2022 FINAL
P. 41

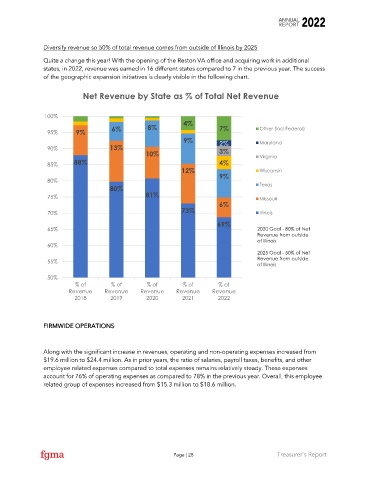
Diversify revenue so 50% of total revenue comes from outside of Illinois by 2025

               Quite a change this year! With the opening of the Reston VA office and acquiring work in additional
               states, in 2022, revenue was earned in 16 different states compared to 7 in the previous year. The success
               of the geographic expansion initiatives is clearly visible in the following chart.

                            Net Revenue by State as % of Total Net Revenue


                100%                                          4%

                 95%      9%          6%          8%                      7%           Other (incl Federal)
                                                              9%          2%           Maryland
                 90%                 13%                                  3%
                                                 10%                                   Virginia
                 85%      88%                                             4%
                                                             12%                       Wisconsin
                 80%                                                      9%
                                     80%                                               Texas
                 75%                             81%                                   Missouri
                                                                          6%
                 70%                                         73%                       Illinois
                                                                         69%
                 65%                                                                  2020 Goal - 80% of Net
                                                                                      Revenue from outside
                                                                                      of Illinois
                 60%
                                                                                      2025 Goal - 50% of Net
                 55%                                                                  Revenue from outside
                                                                                      of Illinois
                 50%
                          % of        % of        % of       % of        % of
                        Revenue     Revenue     Revenue    Revenue     Revenue
                          2018        2019       2020        2021        2022


               FIRMWIDE OPERATIONS


               Along with the significant increase in revenues, operating and non-operating expenses increased from
               $19.6 million to $24.4 million. As in prior years, the ratio of salaries, payroll taxes, benefits, and other
               employee related expenses compared to total expenses remains relatively steady. These expenses
               account for 76% of operating expenses as compared to 78% in the previous year. Overall, this employee
               related group of expenses increased from $15.3 million to $18.6 million.


                                                          Page | 28                          Treasurer’s Report
   36   37   38   39   40   41   42   43   44   45   46