
Page 20 - SDG Report
P. 20
16,7 15,1 11,7 11,4 11,2
9,1 8,3 7,1 6,1 3,8 2,1
0
2
5 2
35 9
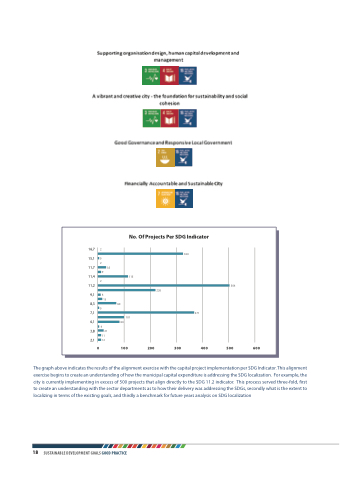
No. Of Projects Per SDG Indicator
334
2
8 13
80 5
4
21 11
12
84
115
226
371
504
500 600
101
100
200 300
400
The graph above indicates the results of the alignment exercise with the capital project implementation per SDG Indicator. This alignment exercise begins to create an understanding of how the municipal capital expenditure is addressing the SDG localization. For example, the city is currently implementing in excess of 500 projects that align directly to the SDG 11.2 indicator. This process served three-fold, first to create an understanding with the sector departments as to how their delivery was addressing the SDGs, secondly what is the extent to localizing in terms of the existing goals, and thirdly a benchmark for future years analysis on SDG localization
18 SUSTAINABLE DEVELOPMENT GOALS GOOD PRACTICE
