
Page 128 - UGU Dstrct Mun IDP Report '21-22
P. 128
3.6 Local Economic Development
This section provides a brief overview of the economic indicators of the Ugu District Municipality area of jurisdiction. The data that has been used was sourced from the Statistics SA Census 2011 and 2016 Community Survey results, DGDS, Ugu LED Strategy, Department of Education, and Department of Health.
3.6.1 Municipal Comparative & Competitive Advantages
The district municipality has a well-developed economic infrastructure in terms roads, highways, railroads, airports, seaports, electricity, telecommunications, water supply and sanitation. All these supports any development that is intended to be established or that already exist within the municipality that helps in developing the economy of the areas within the district. With well-established roads the municipality attracts tourists from other areas which also assist with the economic development of the municipality. The transport infrastructure on the South Coast is well-developed and provides the area with a competitive advantage. The competitive advantage relates particularly to the N2 road and rail access to the south of the eThekwini Municipality, the industrial hub of the Province and eastern seaboard.
The basic airport infrastructure (in terms of specifically the runway) is sufficient to support a much busier aviation sector than is currently the case. Potentially the sea access could also be developed to support the development of the tourism, industrial and commercial sectors. The move of Durban International to the north of Durban will potentially increase the value of the Margate Airport for the region. The linking of production, processing and manufacturing activity around the Margate Airport, to export activities at the Dube Tradeport should receive consideration. The agri-business focus of the Dube Tradeport should specifically be considered in this regard. The Wild Coast N2 road will further link the Ugu District to the Eastern Cape and the urban centres of Umtata, East London and Port Elizabeth. Other than just the linking of urban centres along the eastern seaboard it is also anticipated that the route will develop a new tourism corridor, as well as potentially open up mining opportunities on the coast (to the south of Ugu).
3.6.2 Main Economic Contributors
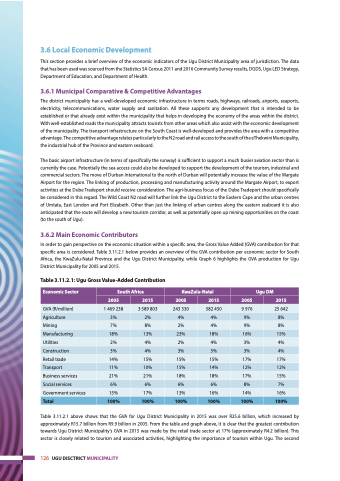
In order to gain perspective on the economic situation within a specific area, the Gross Value Added (GVA) contribution for that specific area is considered. Table 3.11.2.1 below provides an overview of the GVA contribution per economic sector for South Africa, the KwaZulu-Natal Province and the Ugu District Municipality, while Graph 6 highlights the GVA production for Ugu District Municipality for 2005 and 2015.
Table 3.11.2.1: Ugu Gross Value-Added Contribution
Economic Sector
South Africa
KwaZulu-Natal
Ugu DM
2005
2015
2005
2015
2005
2015
GVA (R/million)
1 469 238
3 589 803
243 330
582 450
9 976
25 642
Agriculture
3%
2%
4%
4%
9%
8%
Mining
7%
8%
2%
4%
9%
8%
Manufacturing
18%
13%
23%
18%
16%
15%
Utilities
2%
4%
2%
4%
3%
4%
Construction
3%
4%
3%
5%
3%
4%
Retail trade
14%
15%
15%
15%
17%
17%
Transport
11%
10%
15%
14%
12%
12%
Business services
21%
21%
18%
18%
17%
15%
Social services
6%
6%
6%
6%
8%
7%
Government services
15%
17%
13%
16%
14%
16%
Total
100%
100%
100%
100%
100%
100%
Table 3.11.2.1 above shows that the GVA for Ugu District Municipality in 2015 was over R25.6 billion, which increased by approximately R15.7 billion from R9.9 billion in 2005. From the table and graph above, it is clear that the greatest contribution towards Ugu District Municipality’s GVA in 2015 was made by the retail trade sector at 17% (approximately R4.2 billion). This sector is closely related to tourism and associated activities, highlighting the importance of tourism within Ugu. The second
126 UGU DISCTRICT MUNICIPALITY
