
Page 130 - UGU Dstrct Mun IDP Report '21-22
P. 130
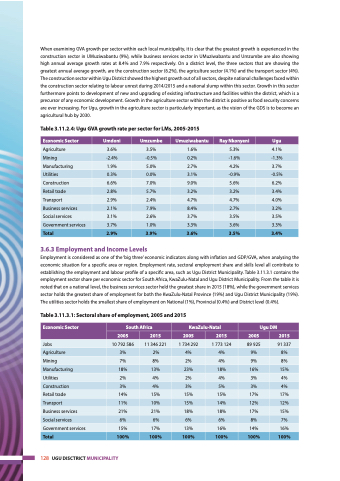
 When examining GVA growth per sector within each local municipality, it is clear that the greatest growth is experienced in the construction sector in UMuziwabantu (9%), while business services sector in UMuziwabantu and Umzumbe are also showing high annual average growth rates at 8.4% and 7.9% respectively. On a district level, the three sectors that are showing the greatest annual average growth, are the construction sector (6.2%), the agriculture sector (4.1%) and the transport sector (4%). The construction sector within Ugu District showed the highest growth out of all sectors, despite national challenges faced within the construction sector relating to labour unrest during 2014/2015 and a national slump within this sector. Growth in this sector furthermore points to development of new and upgrading of existing infrastructure and facilities within the district, which is a precursor of any economic development. Growth in the agriculture sector within the district is positive as food security concerns are ever increasing. For Ugu, growth in the agriculture sector is particularly important, as the vision of the GDS is to become an agricultural hub by 2030.
Table 3.11.2.4: Ugu GVA growth rate per sector for LMs, 2005-2015
 Economic Sector
 Umdoni
 Umzumbe
 Umuziwabantu
 Ray Nkonyeni
 Ugu
 Agriculture
 3.6%
 3.5%
 1.6%
 5.3%
 4.1%
 Mining
 -2.4%
 -0.5%
 0.2%
 -1.6%
 -1.3%
 Manufacturing
 1.9%
 5.0%
 2.7%
 4.2%
 3.7%
 Utilities
 0.3%
 0.0%
 3.1%
 -0.9%
 -0.5%
 Construction
 6.6%
 7.0%
 9.0%
 5.6%
 6.2%
 Retail trade
 2.8%
 5.7%
 3.2%
 3.2%
 3.4%
 Transport
 2.9%
 2.4%
 4.7%
 4.7%
 4.0%
 Business services
 2.1%
 7.9%
 8.4%
 2.7%
 3.2%
 Social services
 3.1%
 2.6%
 3.7%
 3.5%
 3.5%
 Government services
 3.7%
 1.0%
 3.3%
 3.6%
 3.3%
 Total
  2.9%
  3.9%
  3.6%
  3.5%
  3.4%
    3.6.3 Employment and Income Levels
Employment is considered as one of the ‘big three’ economic indicators along with inflation and GDP/GVA, when analysing the economic situation for a specific area or region. Employment rate, sectoral employment share and skills level all contribute to establishing the employment and labour profile of a specific area, such as Ugu District Municipality. Table 3.11.3.1 contains the employment sector share per economic sector for South Africa, KwaZulu-Natal and Ugu District Municipality. From the table it is noted that on a national level, the business services sector held the greatest share in 2015 (18%), while the government services sector holds the greatest share of employment for both the KwaZulu-Natal Province (19%) and Ugu District Municipality (19%). The utilities sector holds the smallest share of employment on National (1%), Provincial (0.4%) and District level (0.4%).
Table 3.11.3.1: Sectoral share of employment, 2005 and 2015
 Economic Sector
 South Africa
 KwaZulu-Natal
 Ugu DM
 2005
 2015
 2005
 2015
 2005
 2015
 Jobs
  10 792 586
  11 346 221
  1 734 292
  1 773 124
  89 925
  91 337
 Agriculture
3%
2%
4%
4%
9%
8%
 Mining
 7%
 8%
 2%
 4%
 9%
 8%
 Manufacturing
 18%
 13%
 23%
 18%
 16%
 15%
 Utilities
 2%
 4%
 2%
 4%
 3%
 4%
 Construction
 3%
 4%
 3%
 5%
 3%
 4%
 Retail trade
 14%
 15%
 15%
 15%
 17%
 17%
 Transport
 11%
 10%
 15%
 14%
 12%
 12%
 Business services
 21%
 21%
 18%
 18%
 17%
 15%
 Social services
 6%
 6%
 6%
 6%
 8%
 7%
 Government services
 15%
 17%
 13%
 16%
 14%
 16%
 Total
  100%
  100%
  100%
  100%
  100%
  100%
    128 UGU DISCTRICT MUNICIPALITY
