
Page 132 - UGU Dstrct Mun IDP Report '21-22
P. 132
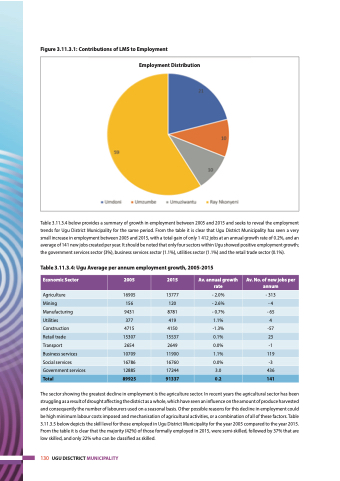
 Figure 3.11.3.1: Contributions of LMS to Employment
Table 3.11.3.4 below provides a summary of growth in employment between 2005 and 2015 and seeks to reveal the employment trends for Ugu District Municipality for the same period. From the table it is clear that Ugu District Municipality has seen a very small increase in employment between 2005 and 2015, with a total gain of only 1 412 jobs at an annual growth rate of 0.2%, and an average of 141 new jobs created per year. It should be noted that only four sectors within Ugu showed positive employment growth; the government services sector (3%), business services sector (1.1%), utilities sector (1.1%) and the retail trade sector (0.1%).
Table 3.11.3.4: Ugu Average per annum employment growth, 2005-2015
 Employment Distribution
 Economic Sector
 2005
 2015
 Av. annual growth rate
 Av. No. of new jobs per annum
 Agriculture
 16905
 13777
 - 2.0%
 - 313
 Mining
 156
 120
 - 2.6%
 -4
 Manufacturing
 9431
 8781
 - 0.7%
 - 65
 Utilities
 377
 419
 1.1%
 4
 Construction
 4715
 4150
 -1.3%
 -57
 Retail trade
 15307
 15537
 0.1%
 23
 Transport
 2654
 2649
 0.0%
 -1
 Business services
 10709
 11900
 1.1%
 119
 Social services
 16786
 16760
 0.0%
 -3
 Government services
 12885
 17244
 3.0
 436
 Total
  89925
  91337
  0.2
  141
    The sector showing the greatest decline in employment is the agriculture sector. In recent years the agricultural sector has been struggling as a result of drought affecting the district as a whole, which have seen an influence on the amount of produce harvested and consequently the number of labourers used on a seasonal basis. Other possible reasons for this decline in employment could be high minimum labour costs imposed and mechanisation of agricultural activities, or a combination of all of these factors. Table 3.11.3.5 below depicts the skill level for those employed in Ugu District Municipality for the year 2005 compared to the year 2015. From the table it is clear that the majority (42%) of those formally employed in 2015, were semi-skilled, followed by 37% that are low skilled, and only 22% who can be classified as skilled.
130 UGU DISCTRICT MUNICIPALITY
