
Page 133 - UGU Dstrct Mun IDP Report '21-22
P. 133
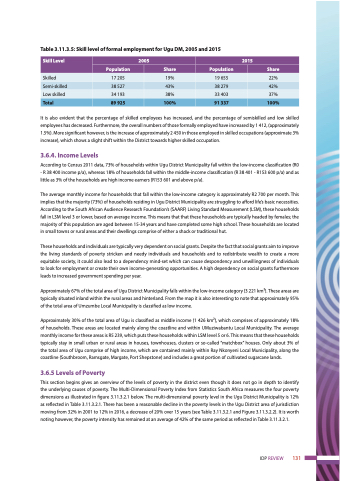
 Table 3.11.3.5: Skill level of formal employment for Ugu DM, 2005 and 2015
It is also evident that the percentage of skilled employees has increased, and the percentage of semiskilled and low skilled employees has decreased. Furthermore, the overall numbers of those formally employed have increased by 1 412, (approximately 1.5%). More significant however, is the increase of approximately 2 450 in those employed in skilled occupations (approximate 3% increase), which shows a slight shift within the District towards higher skilled occupation.
3.6.4. Income Levels
According to Census 2011 data, 73% of households within Ugu District Municipality fall within the low-income classification (R0 - R 38 400 income p/a), whereas 18% of households fall within the middle-income classification (R 38 401 - R153 600 p/a) and as little as 3% of the households are high income earners (R153 601 and above p/a).
The average monthly income for households that fall within the low-income category is approximately R2 700 per month. This implies that the majority (73%) of households residing in Ugu District Municipality are struggling to afford life’s basic necessities. According to the South African Audience Research Foundation’s (SAARF) Living Standard Measurement (LSM), these households fall in LSM level 3 or lower, based on average income. This means that that these households are typically headed by females; the majority of this population are aged between 15-34 years and have completed some high school. These households are located in small towns or rural areas and their dwellings comprise of either a shack or traditional hut.
These households and individuals are typically very dependent on social grants. Despite the fact that social grants aim to improve the living standards of poverty stricken and needy individuals and households and to redistribute wealth to create a more equitable society, it could also lead to a dependency mind-set which can cause despondency and unwillingness of individuals to look for employment or create their own income-generating opportunities. A high dependency on social grants furthermore leads to increased government spending per year.
Approximately 67% of the total area of Ugu District Municipality falls within the low-income category (3 221 km2). These areas are typically situated inland within the rural areas and hinterland. From the map it is also interesting to note that approximately 95% of the total area of Umzumbe Local Municipality is classified as low income.
Approximately 30% of the total area of Ugu is classified as middle income (1 426 km2), which comprises of approximately 18% of households. These areas are located mainly along the coastline and within UMuziwabantu Local Municipality. The average monthly income for these areas is R5 239, which puts these households within LSM level 5 or 6. This means that these households typically stay in small urban or rural areas in houses, townhouses, clusters or so-called “matchbox” houses. Only about 3% of the total area of Ugu comprise of high income, which are contained mainly within Ray Nkonyeni Local Municipality, along the coastline (Southbroom, Ramsgate, Margate, Port Shepstone) and includes a great portion of cultivated sugarcane lands.
3.6.5 Levels of Poverty
This section begins gives an overview of the levels of poverty in the district even though it does not go in depth to identify the underlying causes of poverty. The Multi-Dimensional Poverty Index from Statistics South Africa measures the four poverty dimensions as illustrated in figure 3.11.3.2.1 below. The multi-dimensional poverty level in the Ugu District Municipality is 12% as reflected in Table 3.11.3.2.1. There has been a reasonable decline in the poverty levels in the Ugu District area of jurisdiction moving from 32% in 2001 to 12% in 2016, a decrease of 20% over 15 years (see Table 3.11.3.2.1 and Figure 3.11.3.2.2). It is worth noting however, the poverty intensity has remained at an average of 42% of the same period as reflected in Table 3.11.3.2.1.
 Skill Level
 2005
 2015
 Population
 Share
 Population
 Share
 Skilled
 17 205
 19%
 19 655
 22%
 Semi-skilled
 38 527
 43%
 38 279
 42%
 Low skilled
 34 193
 38%
 33 403
 37%
 Total
  89 925
  100%
  91 337
  100%
    IDP REVIEW 131
