
Page 129 - UGU Dstrct Mun IDP Report '21-22
P. 129
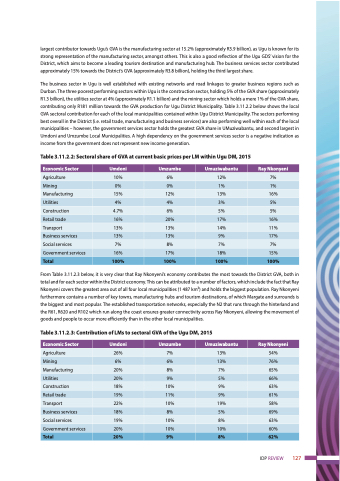
 largest contributor towards Ugu’s GVA is the manufacturing sector at 15.2% (approximately R3.9 billion), as Ugu is known for its strong representation of the manufacturing sector, amongst others. This is also a good reflection of the Ugu GDS’ vision for the District, which aims to become a leading tourism destination and manufacturing hub. The business services sector contributed approximately 15% towards the District’s GVA (approximately R3.8 billion), holding the third largest share.
The business sector in Ugu is well established with existing networks and road linkages to greater business regions such as Durban. The three poorest performing sectors within Ugu is the construction sector, holding 5% of the GVA share (approximately R1.3 billion), the utilities sector at 4% (approximately R1.1 billion) and the mining sector which holds a mere 1% of the GVA share, contributing only R181 million towards the GVA production for Ugu District Municipality. Table 3.11.2.2 below shows the local GVA sectoral contribution for each of the local municipalities contained within Ugu District Municipality. The sectors performing best overall in the District (i.e. retail trade, manufacturing and business services) are also performing well within each of the local municipalities – however, the government services sector holds the greatest GVA share in UMuziwabantu, and second largest in Umdoni and Umzumbe Local Municipalities. A high dependency on the government services sector is a negative indication as income from the government does not represent new income generation.
Table 3.11.2.2: Sectoral share of GVA at current basic prices per LM within Ugu DM, 2015
 Economic Sector
 Umdoni
 Umzumbe
 Umuziwabantu
 Ray Nkonyeni
 Agriculture
 10%
 6%
 12%
 7%
 Mining
 0%
 0%
 1%
 1%
 Manufacturing
 15%
 12%
 13%
 16%
 Utilities
 4%
 4%
 3%
 5%
 Construction
 4.7%
 6%
 5%
 5%
 Retail trade
 16%
 20%
 17%
 16%
 Transport
 13%
 13%
 14%
 11%
 Business services
 13%
 13%
 9%
 17%
 Social services
 7%
 8%
 7%
 7%
 Government services
 16%
 17%
 18%
 15%
 Total
  100%
  100%
  100%
  100%
    From Table 3.11.2.3 below, it is very clear that Ray Nkonyeni’s economy contributes the most towards the District GVA, both in total and for each sector within the District economy. This can be attributed to a number of factors, which include the fact that Ray Nkonyeni covers the greatest area out of all four local municipalities (1 487 km2) and holds the biggest population. Ray Nkonyeni furthermore contains a number of key towns, manufacturing hubs and tourism destinations, of which Margate and surrounds is the biggest and most popular. The established transportation networks, especially the N2 that runs through the hinterland and the R61, R620 and R102 which run along the coast ensures greater connectivity across Ray Nkonyeni, allowing the movement of goods and people to occur more efficiently than in the other local municipalities.
Table 3.11.2.3: Contribution of LMs to sectoral GVA of the Ugu DM, 2015
 Economic Sector
 Umdoni
 Umzumbe
 Umuziwabantu
 Ray Nkonyeni
 Agriculture
 26%
 7%
 13%
 54%
 Mining
 6%
 6%
 13%
 76%
 Manufacturing
 20%
 8%
 7%
 65%
 Utilities
 20%
 9%
 5%
 66%
 Construction
 18%
 10%
 9%
 63%
 Retail trade
 19%
 11%
 9%
 61%
 Transport
 22%
 10%
 19%
 58%
 Business services
 18%
 8%
 5%
 69%
 Social services
 19%
 10%
 8%
 63%
 Government services
 20%
 10%
 10%
 60%
 Total
  20%
  9%
  8%
  62%
    IDP REVIEW 127
