
Page 47 - DUT Annual Report 2024
P. 47
Overall, doctoral graduates increased by 41.0% in 2024 compared to 2023. The Faculty of Management Sciences led with 64 doctoral graduates, accounting for 55% of the total 117 doctoral cohort, followed by Health Sciences with 16 doctorates (+8%). However, the Faculty of Arts and Design remained static in doctoral graduates. Positive growth was observed in Applied Sciences (+40%) and Engineering and the Built Environment (+27.3%) for 2023–2024, although most faculties had fewer than 10 doctoral graduates.
Cohort studies
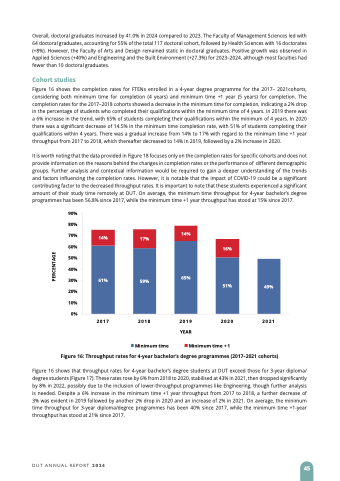
Figure 16 shows the completion rates for FTENs enrolled in a 4-year degree programme for the 2017– 2021cohorts, considering both minimum time for completion (4 years) and minimum time +1 year (5 years) for completion. The completion rates for the 2017–2018 cohorts showed a decrease in the minimum time for completion, indicating a 2% drop in the percentage of students who completed their qualifications within the minimum time of 4 years. In 2019 there was a 6% increase in the trend, with 65% of students completing their qualifications within the minimum of 4 years. In 2020 there was a significant decrease of 14.5% in the minimum time completion rate, with 51% of students completing their qualifications within 4 years. There was a gradual increase from 14% to 17% with regard to the minimum time +1 year throughput from 2017 to 2018, which thereafter decreased to 14% in 2019, followed by a 2% increase in 2020.
It is worth noting that the data provided in Figure 18 focuses only on the completion rates for specific cohorts and does not provide information on the reasons behind the changes in completion rates or the performance of different demographic groups. Further analysis and contextual information would be required to gain a deeper understanding of the trends and factors influencing the completion rates. However, it is notable that the impact of COVID-19 could be a significant contributing factor to the decreased throughput rates. It is important to note that these students experienced a significant amount of their study time remotely at DUT. On average, the minimum time throughput for 4-year bachelor’s degree programmes has been 56.8% since 2017, while the minimum time +1 year throughput has stood at 15% since 2017.
90% 80% 70% 60% 50% 40% 30% 20% 10%
0%
14%
61%
17%
59%
14%
65%
16%
51%
49%
2017
2018 2019 2020 2021 YEAR
Minimum time
Minimum time + 1
Figure 16: Throughput rates for 4-year bachelor’s degree programmes (2017–2021 cohorts)
Figure 16 shows that throughput rates for 4-year bachelor’s degree students at DUT exceed those for 3-year diploma/ degree students (Figure 17). These rates rose by 6% from 2018 to 2020, stabilised at 43% in 2021, then dropped significantly by 8% in 2022, possibly due to the inclusion of lower-throughput programmes like Engineering, though further analysis is needed. Despite a 6% increase in the minimum time +1 year throughput from 2017 to 2018, a further decrease of 3% was evident in 2019 followed by another 2% drop in 2020 and an increase of 2% in 2021. On average, the minimum time throughput for 3-year diploma/degree programmes has been 40% since 2017, while the minimum time +1-year throughput has stood at 21% since 2017.
DUT ANNUAL REPORT 2024
45
PERCENTAGE
