
Page 50 - UKZN Proceedings of the Conference Report
P. 50
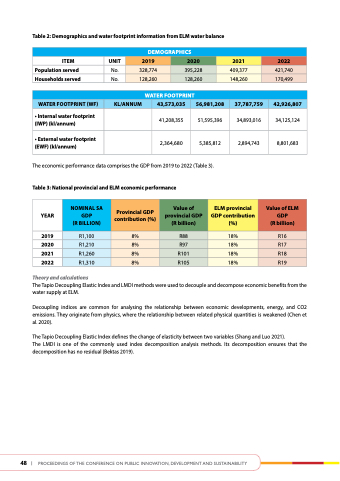
table 2: demographics and water footprint information from eLM water balance
  deMograPhICS
         2019
2020
2021
   328,774
395,228
409,377
2022
 421,740
    128,260
128,260
148,260
170,499
    IteM uNIt
Population served No.
households served No.
• Internal water footprint (IWP) (kl/annum)
• External water footprint (eWf) (kl/annum)
41,208,355
2,364,680
51,595,396
5,385,812
34,893,016
2,894,743
34,125,124
8,801,683
         Water footPrINt
 Water footPrINt (Wf)
  KL/aNNuM
  43,573,035
  56,981,208
  37,787,759
  42,926,807
    The economic performance data comprises the GDP from 2019 to 2022 (Table 3).
table 3: National provincial and eLM economic performance
2019 2020 2021 2022
Theory and calculations
          year
NoMINaL Sa gdP
(r BILLIoN)
Provincial gdP contribution (%)
value of provincial gdP (r billion)
eLM provincial gdP contribution (%)
value of eLM gdP
(r billion)
     R1,100
8%
R88
18%
R16
     R1,210
8%
R97
18%
R17
     R1,260
8%
R101
R18
    R1,310
8%
R105
18%
 18%
R19
              The Tapio Decoupling Elastic Index and LMDI methods were used to decouple and decompose economic benefits from the water supply at ELM.
Decoupling indices are common for analysing the relationship between economic developments, energy, and CO2 emissions. They originate from physics, where the relationship between related physical quantities is weakened (Chen et al. 2020).
The Tapio Decoupling Elastic Index defines the change of elasticity between two variables (Shang and Luo 2021).
The LMDI is one of the commonly used index decomposition analysis methods. Its decomposition ensures that the decomposition has no residual (Bektas 2019).
 48 | Proceedings of the conference on Public innovation, develoPment and sustainability
