
Page 52 - UKZN Proceedings of the Conference Report
P. 52
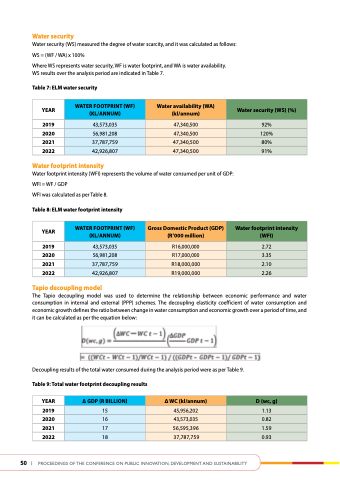
Water security
Water security (WS) measured the degree of water scarcity, and it was calculated as follows: WS = (WF / WA) x 100%
Where WS represents water security, WF is water footprint, and WA is water availability. WS results over the analysis period are indicated in Table 7.
table 7: eLM water security
year
2019 2020 2021 2022
Water footprint intensity
Water footprint intensity (WFI) represents the volume of water consumed per unit of GDP: WFI = WF / GDP
WFI was calculated as per Table 8.
table 8: eLM water footprint intensity
year
2019 2020 2021 2022
tapio decoupling model
The Tapio decoupling model was used to determine the relationship between economic performance and water consumption in internal and external (PPP) schemes. The decoupling elasticity coefficient of water consumption and economic growth defines the ratio between change in water consumption and economic growth over a period of time, and it can be calculated as per the equation below:
Decoupling results of the total water consumed during the analysis period were as per Table 9.
table 9: total water footprint decoupling results
year 2019 2020 2021 2022
   Water footPrINt (Wf) (KL/aNNuM)
  Water availability (Wa) (kl/annum)
  Water security (WS) (%)
 43,573,035
 47,340,500
 92%
 56,981,208
 47,340,500
 120%
 37,787,759
 47,340,500
 80%
 42,926,807
  47,340,500
  91%
            Water footPrINt (Wf) (KL/aNNuM)
  gross domestic Product (gdP) (r’000 million)
  Water footprint intensity (WfI)
 43,573,035
 R16,000,000
 2.72
 56,981,208
 R17,000,000
 3.35
 37,787,759
 R18,000,000
 2.10
 42,926,807
  R19,000,000
  2.26
             ∆ gdP (r BILLIoN)
  ∆ WC (kl/annum)
  d (wc, g)
 15
 45,956,202
 1.13
 16
 43,573,035
 0.82
 17
 56,595,396
 1.59
 18
  37,787,759
  0.93
          50 |
Proceedings of the conference on Public innovation, develoPment and sustainability
