
Page 51 - UKZN Proceedings of the Conference Report
P. 51
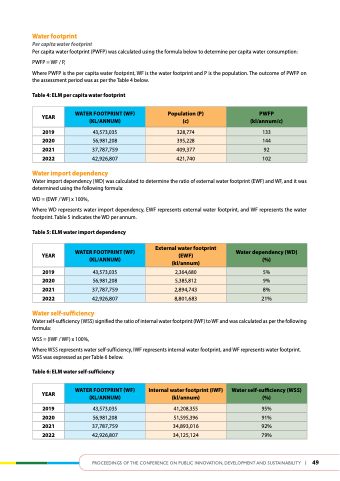
Water footprint
Per capita water footprint
Per capita water footprint (PWFP) was calculated using the formula below to determine per capita water consumption: PWFP = WF / P,
Where PWFP is the per capita water footprint, WF is the water footprint and P is the population. The outcome of PWFP on the assessment period was as per the Table 4 below.
table 4: eLM per capita water footprint
year
2019 2020 2021 2022
Water import dependency
Water import dependency (WD) was calculated to determine the ratio of external water footprint (EWF) and WF, and it was determined using the following formula:
WD = (EWF / WF) x 100%,
Where WD represents water import dependency, EWF represents external water footprint, and WF represents the water footprint. Table 5 indicates the WD per annum.
table 5: eLM water import dependency
year
2019 2020 2021 2022
Water self-sufficiency
Water self-sufficiency (WSS) signified the ratio of internal water footprint (IWF) to WF and was calculated as per the following formula:
WSS = (IWF / WF) x 100%,
Where WSS represents water self-sufficiency, IWF represents internal water footprint, and WF represents water footprint. WSS was expressed as per Table 6 below.
table 6: eLM water self-sufficiency
year
2019 2020 2021 2022
   Water footPrINt (Wf) (KL/aNNuM)
  Population (P) (c)
  PWfP (kl/annum/c)
 43,573,035
 328,774
 133
 56,981,208
 395,228
 144
 37,787,759
 409,377
 92
 42,926,807
  421,740
  102
            Water footPrINt (Wf) (KL/aNNuM)
  external water footprint (eWf) (kl/annum)
  Water dependency (Wd) (%)
 43,573,035
 2,364,680
 5%
 56,981,208
 5,385,812
 9%
 37,787,759
 2,894,743
 8%
 42,926,807
  8,801,683
  21%
            Water footPrINt (Wf) (KL/aNNuM)
  Internal water footprint (IWf) (kl/annum)
  Water self-sufficiency (WSS) (%)
 43,573,035
 41,208,355
 95%
 56,981,208
 51,595,396
 91%
 37,787,759
 34,893,016
 92%
 42,926,807
  34,125,124
  79%
          Proceedings of the conference on Public innovation, develoPment and sustainability | 49
